05Sep

South32 Limited Stock Analysis & Elliott Wave Technical Forecast: Critical Validation Points and Includes a Short-Term Forecast

ASX: SOUTH32 LIMITED – S32 Elliott Wave Analysis TradingLounge (1D Chart)

Greetings, today’s Elliott Wave analysis for the Australian Stock Exchange (ASX) SOUTH32 LIMITED – S32 focuses on the continued downward movement as part of the (Y)-orange wave.

ASX: SOUTH32 LIMITED – S32 Elliott Wave Technical Analysis

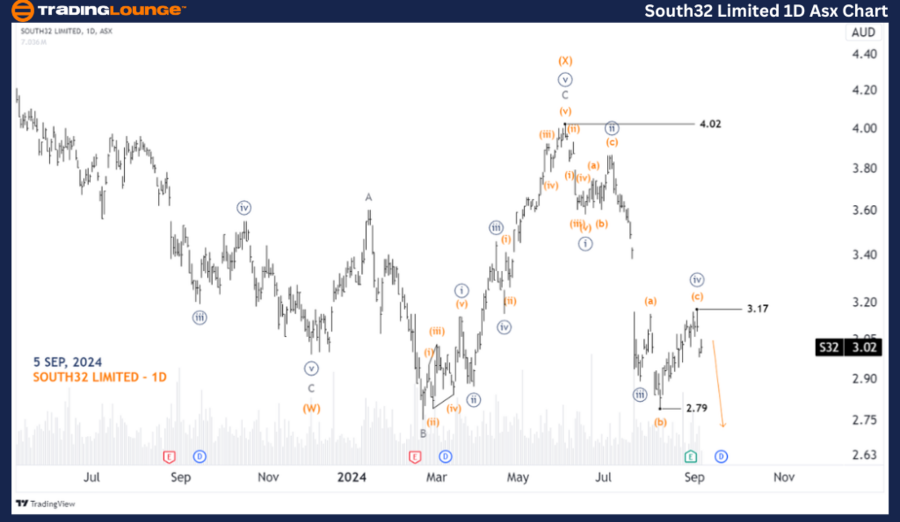
ASX: SOUTH32 LIMITED – S32 1D Chart (Semilog Scale) Analysis

Function: Major Trend (Minor degree, gray)

Mode: Motive

Structure: Impulse

Position: Wave ((v))-navy of Wave A-gray

Details: Wave ((iv))-navy has likely completed as an Expanded Flat at the 3.17 high. Currently, wave ((v))-navy is in progress, pushing lower with a target near the 2.79 low. To maintain this bearish outlook, the price must stay below the 3.17 high.

Invalidation Point: 3.17

South32-Limited-1D-A...


ASX: SOUTH32 LIMITED – S32 Elliott Wave Analysis TradingLounge (4-Hour Chart)

ASX: SOUTH32 LIMITED – S32 Elliott Wave Technical Analysis

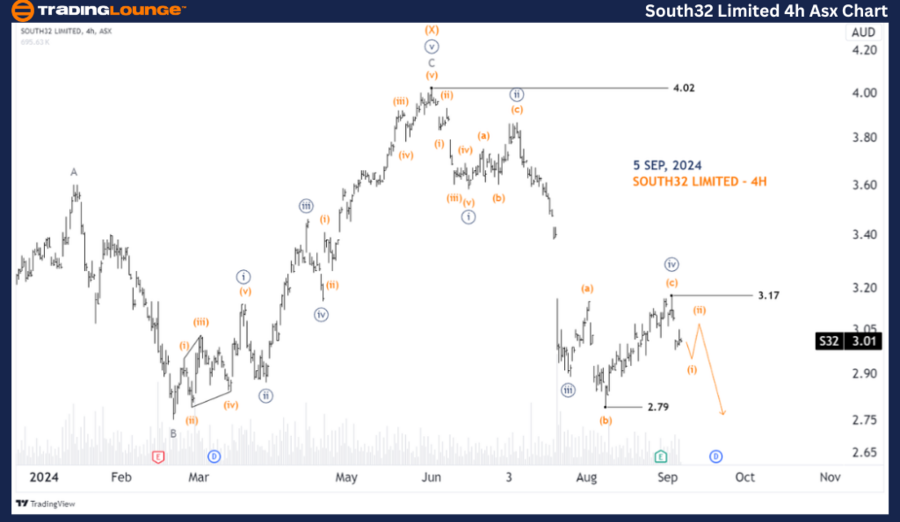
ASX: SOUTH32 LIMITED – S32 4-Hour Chart Analysis

Function: Major Trend (Minute degree, navy)

Mode: Motive

Structure: Impulse

Position: Wave (i)-orange of Wave ((v))-navy

Details:
Wave ((v))-navy is progressing downward and subdividing into wave (i)-orange. After wave (i)-orange completes, wave (ii)-orange is expected to retrace higher before wave (iii)-orange resumes the downtrend toward the 2.79 low target.

Invalidation Point: 3.17

Technical Analyst: Hua (Shane) Cuong, CEWA-M (Master’s Designation).

Source: visit Tradinglounge.com and learn From the Experts Join TradingLounge Here 

See Previous: V300AEQ ETF UNITS – VAS Elliott Wave Technical Analysis

Special Trial Offer - 0.76 Cents a Day for 3 Months! Click here

Access 7 Analysts Over 200 Markets Covered. Chat Room With Support

South32-Limited-4h-A...


Conclusion:

Our Elliott Wave analysis for ASX: SOUTH32 LIMITED – S32 highlights short-term trends and key price levels, providing traders with clear actionable insights. The price levels mentioned serve as confirmation or invalidation points for our wave count, strengthening the reliability of our analysis. This structured approach gives traders a professional, data-driven perspective on the current market movements.

Related

Costco Wholesale Corp.(COST:NASDAQ) Elliott Wave Technical Analysis 11 December 23

Costco Wholesale Corp.(COST:NASDAQ) Elliott Wave Technical Analysis 11 December 23

Costco Wholesale Corp.(COST: NASDAQ) Elliott Wave Technical Analysis Dated 11 December 23 with 1-Hou...

Read More >
ASX WESTPAC BANKING CORPORATION Elliott Wave Analysis: WBC Stock Forecast, Trend Insights, Technical Analysis & Market Outlook

ASX WESTPAC BANKING CORPORATION Elliott Wave Analysis: WBC Stock Forecast, Trend Insights, Technical Analysis & Market Outlook

Our ASX WBC Elliott Wave analysis highlights Westpac Banking Corporation’s stock trends and potenti...

Read More >
Bitcoin/U.S. dollar(BTCUSD) Elliott Wave Technical Analysis 1 November 23

Bitcoin/U.S. dollar(BTCUSD) Elliott Wave Technical Analysis 1 November 23

Bitcoin/U.S. dollar(BTCUSD) Elliott Wave Technical Analysis on 1 November 23 with BTCUSD Analysis Da...

Read More >
Look at ASX LIMITED on the Australian Stock Exchange: ASX Stock Analysis & Elliott Wave Technical Forecast

Look at ASX LIMITED on the Australian Stock Exchange: ASX Stock Analysis & Elliott Wave Technical Forecast

Our Elliott Wave analysis provides an in-depth look at ASX LIMITED on the Australian Stock Exchange....

Read More >
Caterpillar Inc. (CAT) Stocks Elliott Wave Technical Analysis With Insights into Both Upward and Sideways Trends

Caterpillar Inc. (CAT) Stocks Elliott Wave Technical Analysis With Insights into Both Upward and Sideways Trends

This detailed Elliott Wave analysis examines Caterpillar Inc. (CAT) stock trends on daily and 1-hour...

Read More >
 S&P BSE Sensex Index Elliott Wave Analysis Shows Strong Bullish Trend on Daily and Weekly Charts for Indian Stock Market Forecast

S&P BSE Sensex Index Elliott Wave Analysis Shows Strong Bullish Trend on Daily and Weekly Charts for Indian Stock Market Forecast

S&P BSE Sensex highlights strong bullish momentum across both daily and weekly charts. Covering navy...

Read More >

$1 for 2 Weeks

then $29 a month!

What a Special Offer!

Trade Recommendations

Unleash the power of deversified trading with our comprehensive portfolio, covering 250+ markets:

  • Stock Trades
  • Crypto Trades
  • Forex Trades
  • Commodity Trades
Elliott Wave Analysis

Gain a competitive edge with expert insights and AI-powered Elliott Wave charting into:

  • Global Indices
  • US Stocks & ASX Stocks
  • Forex & Crypto
  • Commodities
Top-Notch Trading Tools

Equip yourself with the tools of success:

  • Real-time Chat rooms
  • Elliott Wave Algorithm
  • Portfolio tools
  • TradingLevels
  • Screener
  • Trading Game
7 Elliott Wave Analysts

Stay ahead of the market with daily charts and insightful videos
Your secret to strategic trading!

JOIN HERE


Welcome to TradingLounge (ASIC A.R.No. 321187), specialists in trades, trading education and technical analysis, covering stocks, indices, commodities, forex and cryptocurrencies.

When you join TradingLounge you have access to everything we offer, including trade tools, educational content and a social platform to chat with like-minded investors.

Read more

@Copyright 2024 by tradinglounge.com

Contact Us

Australian no: 02 4787 6020

International no: +61 (2) 47876020

Pay with:

Find us on