16May

Detailed insights into Nvidia Corp.(NVDA) Stocks Elliott Wave Technical Analysis Covering daily and 4-hour charts

NVDA Elliott Wave Analysis: Trading Lounge Daily Chart

Dive into our latest Elliott Wave analysis for NVIDIA (NVDA) Discover key price targets and potential resistance levels in our detailed NVDA stock forecast. Explore how wave patterns suggest significant movements ahead.

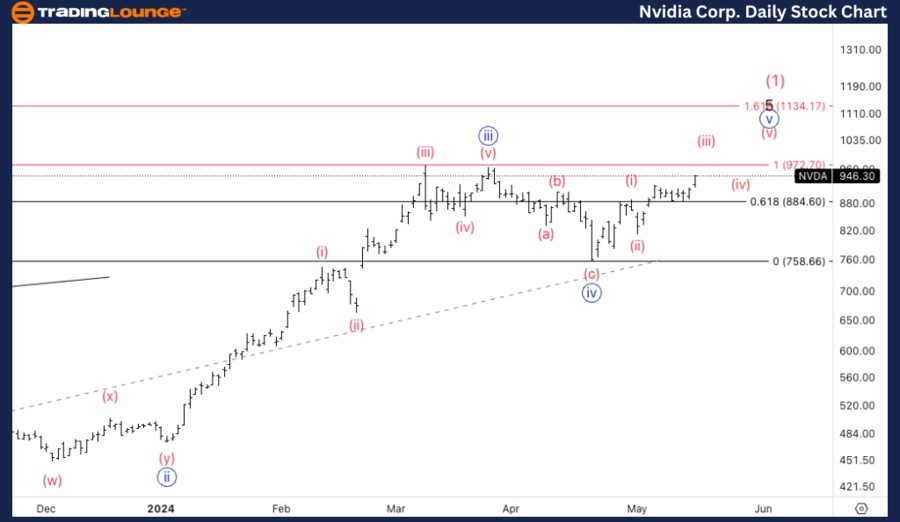
Nvidia Corp. (NVDA) Daily Chart

NVDA Elliott Wave Technical Analysis

Function: Trend

Mode: Impulsive

Structure: Motive

Position: Minute wave {v}

Direction: Upside in wave (iii)

Details: The equality of wave {v} compared to wave {i} is approximately $972. We anticipate resistance at the top of TL1 around $1000.

According to the latest daily chart insights, NVIDIA is currently in Minute wave {v} of a larger wave (iii). This suggests a continuation of the upward momentum in the stock's price. Notably, the equality of wave {v} with wave {i} is projected at $972, indicating where the next significant resistance could form. Additionally, traders should be vigilant as we approach the $1000 mark, coinciding with resistance at Trading Level 1 (TL1).

Nvidia-Corp-Daily-st...


NVDA Elliott Wave Analysis: Trading Lounge 4-Hour Chart

The 4-hour chart refines our understanding, showing NVIDIA in the fifth wave of wave (iii). This segment of the analysis reveals a more immediate bullish.

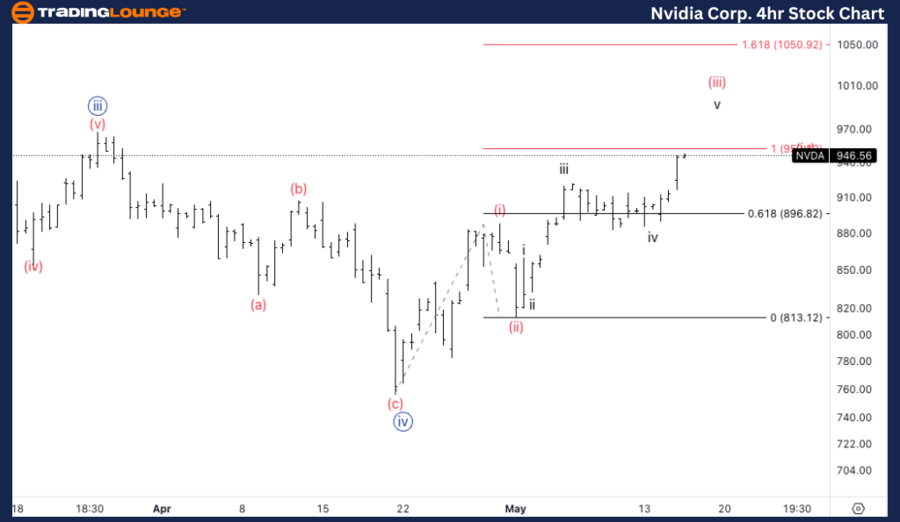
Nvidia Corp. (NVDA) 4-Hour Chart

NVDA Elliott Wave Technical Analysis

Function: Trend

Mode: Impulsive

Structure: Motive

Position: Wave v of (iii)

Direction: Upside in wave v

Details: We are nearing the equality of wave (iii) compared to wave (i). The 1.618 extension of wave (iii) versus wave (i) stands at $1050.

Conclusion: NVDA's Elliott Wave Patterns

In conclusion, Nvidia Corp. (NVDA) shows a strong impulsive trend on both daily and 4-hour charts. Key levels of $972 and $1000 on the daily chart, and $1050 on the 4-hour chart, will be critical for NVDA's price action. Traders should watch these levels closely to gauge potential future movements.

Technical Analyst: Malik Awais

Source: visit Tradinglounge.com and learn From the Experts Join TradingLounge Here 

See Previous: Analog Devices Inc.(ADI) Stocks Elliott Wave Technical Analysis

Special Trial Offer - 0.76 Cents a Day for 3 Months! Click here

Access 7 Analysts Over 170 Markets Covered. Chat Room With Support

Nvidia-Corp-4Hr-stoc...

Related

Amazon Inc.(AMZN:NASDAQ) Elliott Wave Technical Analysis 25 October 23

Amazon Inc.(AMZN:NASDAQ) Elliott Wave Technical Analysis 25 October 23

Amazon Inc.(AMZN:NASDAQ) Elliott Wave Technical Analysis For 25 October 23 with 1-Hour and 4-Hour St...

Read More >
GPT Understanding Elliottwave Technical analysis for Ethereum (ETHUSD): Ethereum Crypto Price News Today

GPT Understanding Elliottwave Technical analysis for Ethereum (ETHUSD): Ethereum Crypto Price News Today

This comprehensive article provides a detailed Elliott Wave analysis of Ethereum (ETHUSD), offering ...

Read More >
Bullish Elliott Wave Technical Forecast for ASX: MINERAL RESOURCES LIMITED – MIN Stock Analysis Targets Wave 5 with Key Support

Bullish Elliott Wave Technical Forecast for ASX: MINERAL RESOURCES LIMITED – MIN Stock Analysis Targets Wave 5 with Key Support

This Elliott Wave analysis explores the bullish setup for ASX: MIN after Wave 4 completion, forecast...

Read More >
NextEra Energy Inc.(NEE) Stocks Elliott Wave Technical Analysis: Covers Stock Predictions, Technical insights, And wave pattern analysis

NextEra Energy Inc.(NEE) Stocks Elliott Wave Technical Analysis: Covers Stock Predictions, Technical insights, And wave pattern analysis

This article provides an in-depth Elliott Wave analysis of NextEra Energy Inc. (NEE) on both daily a...

Read More >
BTCUSD Elliott Wave Analysis: Bitcoin Eyes $118K Target as Wave 5 Ends – Technical Forecast & Trading Strategy Explained

BTCUSD Elliott Wave Analysis: Bitcoin Eyes $118K Target as Wave 5 Ends – Technical Forecast & Trading Strategy Explained

Bitcoin is advancing through its final wave ⑤, aiming for a $118,187 Fibonacci target. Traders shou...

Read More >
Insights into the Current Trends in the ASX Market: ASX LIMITED Stock Analysis & ASX Elliott Wave Technical Forecast

Insights into the Current Trends in the ASX Market: ASX LIMITED Stock Analysis & ASX Elliott Wave Technical Forecast

This article provides an in-depth Elliott Wave analysis of ASX Limited, focusing on its potential pr...

Read More >

$1 for 2 Weeks

then $29 a month!

What a Special Offer!

Trade Recommendations

Unleash the power of deversified trading with our comprehensive portfolio, covering 250+ markets:

  • Stock Trades
  • Crypto Trades
  • Forex Trades
  • Commodity Trades
Elliott Wave Analysis

Gain a competitive edge with expert insights and AI-powered Elliott Wave charting into:

  • Global Indices
  • US Stocks & ASX Stocks
  • Forex & Crypto
  • Commodities
Top-Notch Trading Tools

Equip yourself with the tools of success:

  • Real-time Chat rooms
  • Elliott Wave Algorithm
  • Portfolio tools
  • TradingLevels
  • Screener
  • Trading Game
7 Elliott Wave Analysts

Stay ahead of the market with daily charts and insightful videos
Your secret to strategic trading!

JOIN HERE


Welcome to TradingLounge (ASIC A.R.No. 321187), specialists in trades, trading education and technical analysis, covering stocks, indices, commodities, forex and cryptocurrencies.

When you join TradingLounge you have access to everything we offer, including trade tools, educational content and a social platform to chat with like-minded investors.

Read more

@Copyright 2024 by tradinglounge.com

Contact Us

Australian no: 02 4787 6020

International no: +61 (2) 47876020

Pay with:

Find us on