11Dec

Maruti Suzuki Stock Analysis: Elliott Wave Trends, Daily and 4H Chart Patterns, Resistance Levels, and Price Movement Insights

MARUTI SUZUKI INDIA – MARUTI (1D Chart) Elliott Wave Technical Analysis

MARUTI Elliott Wave Technical Analysis

Function: Counter Trend Lower (Intermediate Degree, Orange)

Mode: Corrective

Structure: Impulse within Larger Degree Wave A

Position: Minute Wave ((iii)) Navy

Details: Minute Wave ((iii)) continues moving lower, extending against the resistance zone at 13,680.

Invalidation Point: 13,680–13,685

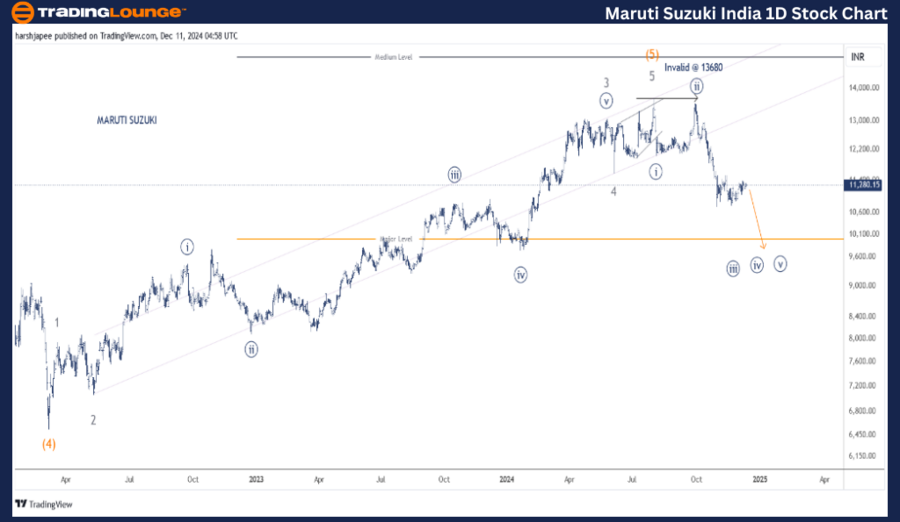
MARUTI SUZUKI Daily Chart Technical Analysis and Potential Elliott Wave Counts

The daily chart for MARUTI SUZUKI highlights a possible trend reversal after the completion of Minor Wave 5 Grey within Intermediate Wave (5) Orange, peaking around the 13,680 resistance level. The stock appears poised to finalize its initial impulse wave lower, with Minute sub-waves unfolding against the 13,680 resistance.

Key observations:

  • MARUTI SUZUKI saw a significant drop to 6,530 in March 2022, marking the conclusion of Intermediate Wave (4) Orange.
  • The subsequent rally unfolded as an impulse consisting of Minor Waves 1 through 5 Grey.
  • Notably, Wave 3 was an extension, while Wave 5 formed a diagonal pattern.

If this analysis is accurate, a major top has been established near the 13,680 levels, with the first impulse wave lower continuing to take shape.

MARUTI-SUZUKI-INDIA-...


MARUTI SUZUKI INDIA – MARUTI (4H Chart) Elliott Wave Technical Analysis

Function: Counter Trend Lower (Intermediate Degree, Orange)

Mode: Corrective

Structure: Impulse within Larger Degree Wave A

Position: Minute Wave ((iii)) Navy

Details: Minute Wave ((iii)) remains in progress, moving lower as an extension against the 13,680 resistance. Minuette Wave (iv) may currently be developing as a triangle.

Invalidation Point: 13,680–13,685

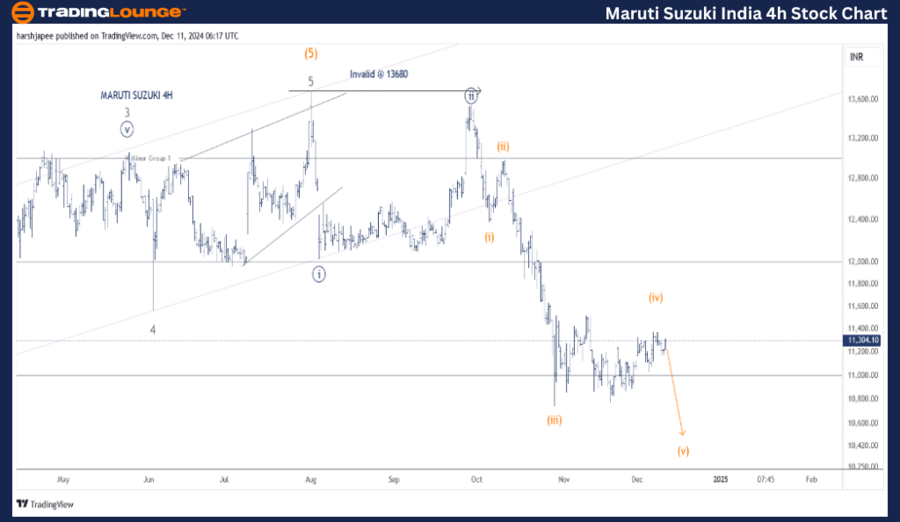
MARUTI SUZUKI 4H Chart Technical Analysis and Potential Elliott Wave Counts

The 4H chart for MARUTI SUZUKI outlines sub-wave developments after Minor Wave 3 Grey terminated around the 13,065 level. Minor Wave 4 unfolded as a zigzag, concluding near 11,540, while Minor Wave 5 surpassed 13,680, forming an ending diagonal.

Additional insights:

  • The stock sharply reversed from the 13,680 levels, initiating an impulse wave downward.
  • Minute Waves ((i)) and ((ii)) have already formed around 12,060 and 13,600–13,650 levels, respectively.
  • If this wave structure holds, prices are expected to continue trending lower as Minute Wave ((iii)) extends further.

Technical Analyst: Harsh Japee

Source: visit Tradinglounge.com and learn From the Experts Join TradingLounge Here 

Previous: HDFCLIFE Elliott Wave Technical Analysis 

VALUE Offer - Buy 1 Month & Get 3 Months!Click here

Access 7 Analysts Over 200 Markets Covered. Chat Room With Support

MARUTI-SUZUKI-INDIA-...


Conclusion

MARUTI SUZUKI is trending lower within Minute Wave ((iii)) Navy, maintaining resistance at 13,680.

Related

GPT Understanding Elliottwave Technical analysis for Ethereum (ETHUSD): Ethereum Crypto Price News Today

GPT Understanding Elliottwave Technical analysis for Ethereum (ETHUSD): Ethereum Crypto Price News Today

This comprehensive article provides a detailed Elliott Wave analysis of Ethereum (ETHUSD), offering ...

Read More >
Elliott Wave Analysis: VeChain (VETUSD) Technical Outlook - February 2, 2024

Elliott Wave Analysis: VeChain (VETUSD) Technical Outlook - February 2, 2024

Elliott Wave Analysis reveals potential trading opportunities for VeChain (VETUSD) on February 2, 20...

Read More >
Our ASX Wisetech Global Limited Stock Analysis Covers Short-term Movements and Outlooks: WTC Elliott Wave Forecast

Our ASX Wisetech Global Limited Stock Analysis Covers Short-term Movements and Outlooks: WTC Elliott Wave Forecast

Our detailed Elliott Wave analysis for ASX: Wisetech Global Limited (WTC) provides key insights into...

Read More >
Actionable Insights on NASDAQ Composite Trading with a Focus on Elliott Wave Analysis and NDX forecasts

Actionable Insights on NASDAQ Composite Trading with a Focus on Elliott Wave Analysis and NDX forecasts

Discover actionable insights on NASDAQ Composite trading with a focus on Elliott Wave Analysis and N...

Read More >
Bitcoin/USD (BTCUSD) Elliott Wave Technical Insights:  Market trends and actionable trading strategies

Bitcoin/USD (BTCUSD) Elliott Wave Technical Insights: Market trends and actionable trading strategies

Delve into the latest Elliott Wave analysis for Bitcoin/USD (BTCUSD) as of February 27, 2024, offeri...

Read More >
Unlock ASX Trading Potential: REA GROUP LTD Stock Analysis & REA Elliott Wave Technical Forecast

Unlock ASX Trading Potential: REA GROUP LTD Stock Analysis & REA Elliott Wave Technical Forecast

Get the latest Elliott Wave analysis for ASX REA Group. Discover key stock trends, wave counts, and ...

Read More >

Buy 1 Month

Get 3 Months!

Special Offer:

Trade Recommendations

Unleash the power of deversified trading with our comprehensive portfolio, covering:

  • Stock Trades
  • Crypto Trades
  • Forex Trades
  • Commodity Trades
Elliott Wave Analysis

Gain a competive edge with expert insights in to:

  • Global Indices
  • US Stocks & ASX Stocks
  • Forex & Crypto
  • Commodities
Top-Notch Trading Tools

Equip yourself with the tools of success:

  • Social Chat
  • Elliott Wave Algorithm
  • Screener
  • TradingLevels
  • Trading Game
7 Elliott Wave Analysts

Stay ahead of the market with daily charts and insightful videos
-Your secret to strategic trading!

JOIN HERE


Welcome to TradingLounge (ASIC A.R.No. 321187), specialists in trades, trading education and technical analysis, covering stocks, indices, commodities, forex and cryptocurrencies.

When you join TradingLounge you have access to everything we offer, including trade tools, educational content and a social platform to chat with like-minded investors.

Read more

@Copyright 2024 by tradinglounge.com

Contact Us

Australian no: 02 4787 6020

International no: +61 (2) 47876020

Pay with:

Find us on