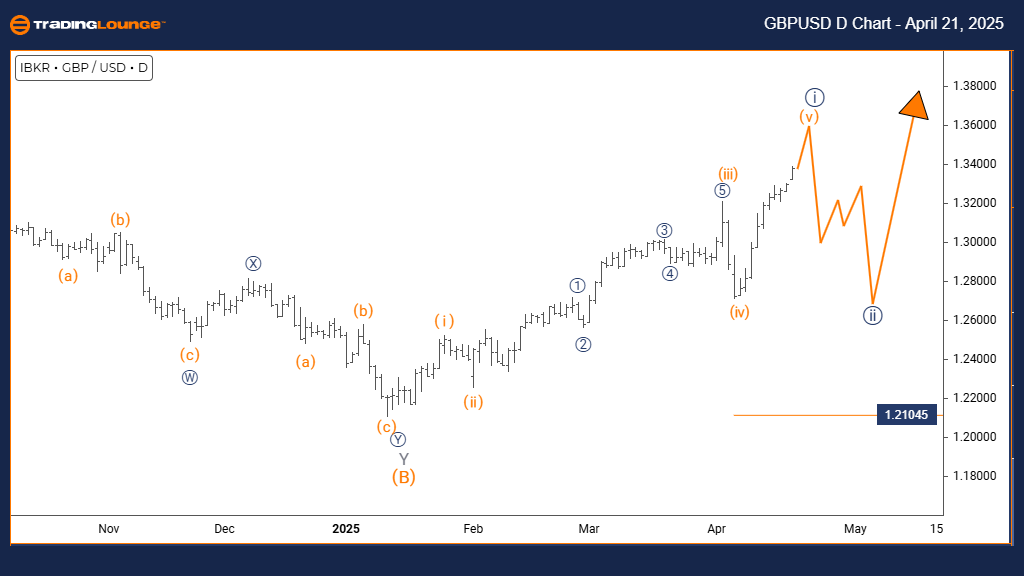
British Pound/U.S. Dollar (GBPUSD) Elliott Wave Analysis – TradingLounge Daily Chart
GBPUSD Elliott Wave Technical Analysis
Function: Trend
Mode: Impulsive
Structure: Navy Blue Wave 1
Position: Gray Wave 1
Next Lower Degrees: Navy Blue Wave 2
Details: Navy blue wave 1 of gray wave 1 remains in progress and is nearing completion.
Invalidation Level: 1.21045
The GBPUSD daily Elliott Wave analysis highlights a developing impulsive trend structure, with the pair currently unfolding within navy blue wave 1 of a broader gray wave 1. This suggests the early stages of a bullish impulse wave, likely to gather strength if the pattern confirms.
Navy blue wave 1 marks the onset of a new uptrend. While typically moderate in pace, wave 1 lays the groundwork for larger moves to follow. As this wave nears completion, traders should prepare for a corrective pullback in wave 2, before the anticipated acceleration in wave 3.
The completion of wave 1 will likely be followed by navy blue wave 2, offering a retracement and potential buy setup ahead of wave 3’s rally. The daily chart supports the outlook for an extended bullish sequence, pending confirmation of this early impulsive phase.
Key invalidation sits at 1.21045. A break below this level would invalidate the current wave count and require reassessment. This support acts as a crucial reference to maintain the bullish bias.
Traders should watch for typical signs of wave 1 exhaustion and prepare for opportunities following the wave 2 correction. With wave 3 expected to bring stronger momentum, aligning entries with technical confirmation will be essential.
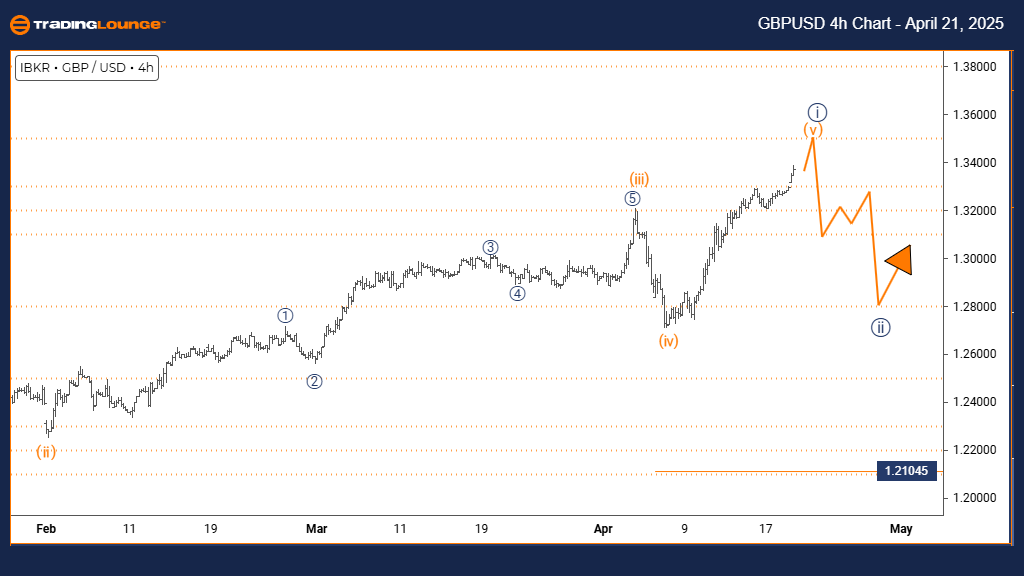
British Pound/U.S. Dollar (GBPUSD) Elliott Wave Analysis – TradingLounge 4-Hour Chart
GBPUSD Elliott Wave Technical Analysis
Function: Trend
Mode: Impulsive
Structure: Orange Wave 5
Position: Navy Blue Wave 1
Next Lower Degrees: Navy Blue Wave 2
Details: Orange wave 4 looks complete, and orange wave 5 is currently in play.
Invalidation Level: 1.21045
On the GBPUSD 4-hour chart, Elliott Wave analysis shows a progressing impulsive trend within orange wave 5, concluding the internal structure of navy blue wave 1. The prior orange wave 4 correction appears complete, clearing the way for the final push higher.
Orange wave 5 often signals the last leg of a bullish impulse, which may attempt to break above recent highs. While this wave can show strength, it can also lose momentum nearing completion. Current conditions suggest this wave is advancing and may soon wrap up the overall five-wave sequence.
Once wave 5 finalizes, navy blue wave 2 is expected to unfold, likely bringing a pullback before any further uptrend continuation. The 1.21045 invalidation level remains key. A drop below this would break the wave count and prompt new analysis.
Traders should look for wave 5 exhaustion indicators, such as bearish divergence or reversal candlestick patterns. The 4-hour timeframe signals the trend may be approaching a turning point, making it critical to monitor for signs of a shift into wave 2.
Technical indicators and price structure will guide traders in identifying when bullish momentum fades. Staying focused on the invalidation level and potential reversal setups will be vital for positioning ahead of the next corrective wave.
Technical Analyst: Malik Awais
Source: Visit Tradinglounge.com and learn from the Experts. Join TradingLounge Here
Previous: EURUSD Elliott Wave Technical Analysis
VALUE Offer - Buy 1 Month & Get 3 Months!Click here
Access 7 Analysts Over 200 Markets Covered. Chat Room With Support