ASX: BHP GROUP LIMITED - TradingLounge (1D Chart)

Greetings, today’s Elliott Wave analysis covers the Australian Stock Exchange (ASX) BHP GROUP LIMITED - BHP. Our analysis indicates that BHP.ASX is expected to move higher in the long term, progressing through wave 3-grey.

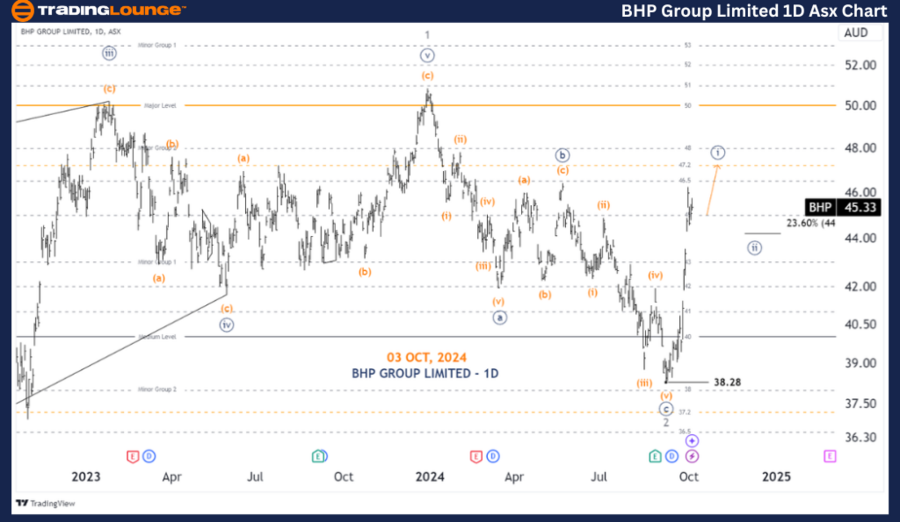
ASX: BHP GROUP LIMITED - BHP 1D Chart (Semilog Scale) Analysis

BHP Elliott Wave Technical Analysis

Function: Major Trend (Minor degree, grey)

Mode: Motive

Structure: Impulse

Position: Wave ((i))-navy of Wave 3-grey

Details: Wave ((i))-navy of wave 3-grey is in motion to push higher. The price must stay above the 23.6% retracement level for this trend to continue. A push lower reveals wave ((ii))-navy unfolding.

Invalidation Point: 38.28

BHP-Group-Limited-1D...


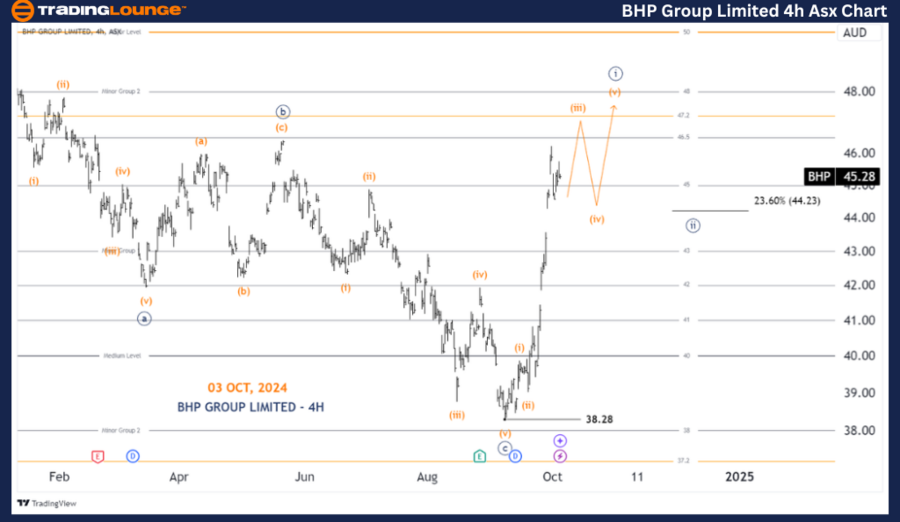
ASX: BHP GROUP LIMITED - BHP 4-Hour Chart Analysis

Function: Major Trend (Minute degree, navy)

Mode: Motive

Structure: Impulse

Position: Wave (iii)-orange of Wave ((i))-navy

Details: Since the recent low at 38.285, wave ((i))-navy is progressing upwards, subdividing into wave (iii)-orange. This wave (iii)-orange is expected to push higher, followed by a pullback in wave (iv)-orange, and finally, wave (v)-orange will push higher, completing wave ((i))-navy.

Invalidation Point: 38.28

Technical Analyst: Hua (Shane) Cuong, CEWA-M (Master’s Designation).

Source: visit Tradinglounge.com and learn From the Experts Join TradingLounge Here 

See Previous: V300AEQ ETF UNITS – VAS Elliott Wave Technical Analysis

VALUE Offer - Buy 1 Month & Get 3 Months!Click here

Access 7 Analysts Over 200 Markets Covered. Chat Room With Support

BHP-Group-Limited-4h...


Conclusion:

Our Elliott Wave analysis on ASX: BHP GROUP LIMITED - BHP offers valuable insights into both long-term trends and short-term movements. The specific price points provided act as crucial validation or invalidation signals for the wave count, allowing traders to make informed decisions. We aim to deliver an objective and professional outlook on market conditions, helping readers effectively capitalize on emerging opportunities.

Related

THETA Token/ U.S. dollar(THETAUSD) Elliott Wave Technical Analysis 4 December 23

THETA Token/ U.S. dollar(THETAUSD) Elliott Wave Technical Analysis 4 December 23

THETA Token and U.S. dollar(THETAUSD) Elliott Wave Technical Analysis dated 4 December 23, TradingLo...

Read More >
Amazon Inc. (AMZN) Elliott Wave Analysis: Amazon Stock Forecast, Market Trends, Trading Strategies, and Investment Insights

Amazon Inc. (AMZN) Elliott Wave Analysis: Amazon Stock Forecast, Market Trends, Trading Strategies, and Investment Insights

Elliott Wave analysis of Amazon (AMZN) stock, including insights into current market trends, wave pa...

Read More >
Silver Price Forecast: Elliott Wave Analysis Predicts Strong Wave 3 Breakout After Completing Wave 2 Correction Above $28

Silver Price Forecast: Elliott Wave Analysis Predicts Strong Wave 3 Breakout After Completing Wave 2 Correction Above $28

Silver remains in a bullish uptrend, currently correcting before an expected wave 3 breakout above 2...

Read More >
Elliott Wave Analysis: S&P 500, NASDAQ 100, DAX 40, FTSE 100, ASX200 Trading Strategies

Elliott Wave Analysis: S&P 500, NASDAQ 100, DAX 40, FTSE 100, ASX200 Trading Strategies

Stock Market Report S&P 500 - NASDAQ 100 - RUSSELL 2000 - DAX 40 - FTSE 100 - ASX 200. Elliott Wave ...

Read More >
British Pound/Japanese Yen (GBPJPY) Elliott Wave Technical Analysis: Bearish Trend, Price Forecast, and Key Levels for Forex Traders

British Pound/Japanese Yen (GBPJPY) Elliott Wave Technical Analysis: Bearish Trend, Price Forecast, and Key Levels for Forex Traders

The GBPJPY Elliott Wave Analysis indicates a strong bearish trend with the market currently progress...

Read More >
JHX Elliott Wave Forecast: James Hardie Industries PLC Stock Analysis & ASX:JHX Price Analysis with Our Latest Technical Outlook

JHX Elliott Wave Forecast: James Hardie Industries PLC Stock Analysis & ASX:JHX Price Analysis with Our Latest Technical Outlook

Our Elliott Wave forecast for JAMES HARDIE INDUSTRIES PLC (JHX) identifies key price movements and t...

Read More >

$1 for 2 Weeks

then $29 a month!

What a Special Offer!

Trade Recommendations

Unleash the power of deversified trading with our comprehensive portfolio, covering 250+ markets:

  • Stock Trades
  • Crypto Trades
  • Forex Trades
  • Commodity Trades
Elliott Wave Analysis

Gain a competitive edge with expert insights and AI-powered Elliott Wave charting into:

  • Global Indices
  • US Stocks & ASX Stocks
  • Forex & Crypto
  • Commodities
Top-Notch Trading Tools

Equip yourself with the tools of success:

  • Real-time Chat rooms
  • Elliott Wave Algorithm
  • Portfolio tools
  • TradingLevels
  • Screener
  • Trading Game
7 Elliott Wave Analysts

Stay ahead of the market with daily charts and insightful videos
Your secret to strategic trading!

JOIN HERE


Welcome to TradingLounge (ASIC A.R.No. 321187), specialists in trades, trading education and technical analysis, covering stocks, indices, commodities, forex and cryptocurrencies.

When you join TradingLounge you have access to everything we offer, including trade tools, educational content and a social platform to chat with like-minded investors.

Read more

@Copyright 2024 by tradinglounge.com

Contact Us

Australian no: 02 4787 6020

International no: +61 (2) 47876020

Pay with:

Find us on