19May

Elliott Wave Forecast for ASX: CAR GROUP LIMITED – CAR Shows Bullish Trend with Key Support and Target Zones Revealed for Traders

ASX: CAR GROUP LIMITED – CAR Elliott Wave Technical Analysis | TradingLounge

Hello Traders,
This updated Elliott Wave analysis for CAR GROUP LIMITED (ASX:CAR), traded on the Australian Stock Exchange, reflects the latest chart data. According to our current assessment, the stock has recently concluded a corrective phase marked as Wave (4) – orange, identified as a Zigzag structure. This completion suggests the potential start of a bullish Wave (5) move, highlighting possible upward price action. The overview below outlines expected market direction along with important support and resistance levels derived from Elliott Wave principles.


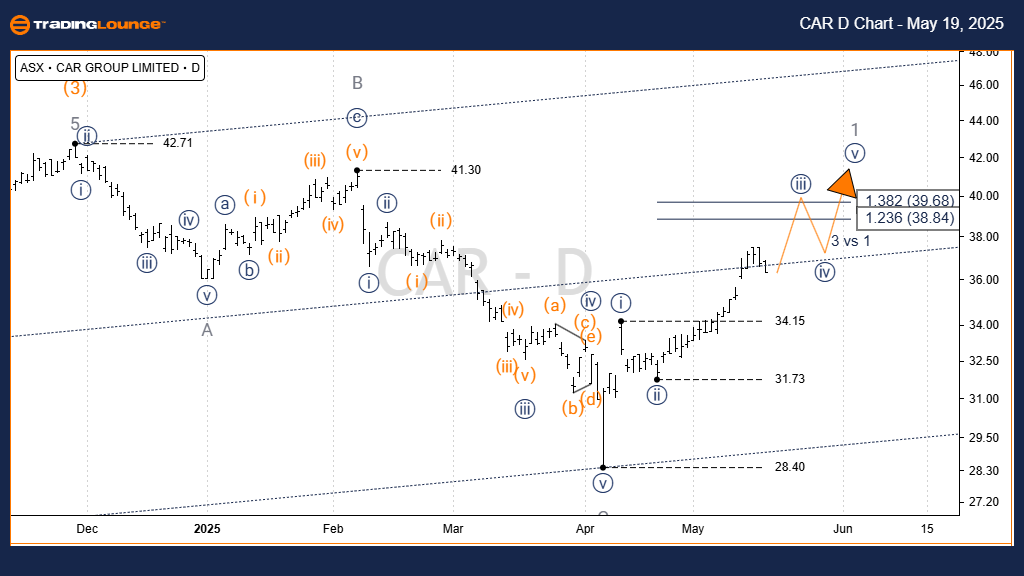
ASX: CAR GROUP LIMITED – CAR Elliott Wave Technical Analysis 1D Chart (Semilog Scale) Review

Trend Level: Intermediate (orange label)

Wave Type: Motive

Pattern: Impulse

Wave Status: In Wave iii)) – navy, inside Wave (5) – orange

Technical Breakdown:
Wave (4) – orange is likely complete near the $28.40 mark, forming a Zigzag composed of subwaves A, B, and C (grey). The final leg, subwave C, appears to be a finished five-wave impulse, reinforcing the start of Wave (5) – orange. Currently, Wave iii)) – navy is advancing toward the resistance zone between $39.68 and $40.00.

Critical Support (Invalidation Level):
A price drop below $31.73 would invalidate this wave count and require reevaluation of the Elliott structure.

CAR-GROUP-d-asx-char...


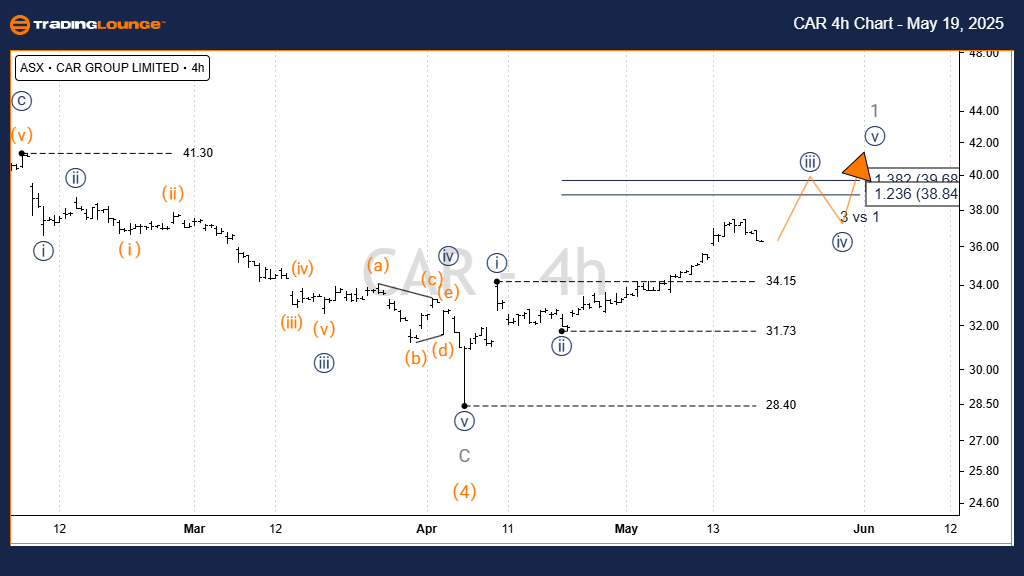
ASX: CAR GROUP LIMITED – CAR Elliott Wave Technical Analysis TradingLounge (4-Hour Chart)

Trend Level: Minor (grey label)

Wave Type: Motive

Pattern: Impulse

Wave Status: In Wave ((iii)) – navy of Wave (5) – orange

Short-Term Analysis:
Wave iii)) – navy continues from the $31.73 pivot, advancing upward. For this bullish Elliott Wave scenario to remain valid, prices must hold above $31.73.

Critical Support (Invalidation Level):
A close below $31.73 would question the current wave count and prompt a structural review.

Technical Analyst: Hua (Shane) Cuong, CEWA-M (Master’s Designation).

Source: Visit Tradinglounge.com and learn from the Experts. Join TradingLounge Here 

See Previous: INSURANCE AUSTRALIA GROUP LIMITED – IAG Elliott Wave Technical Analysis

VALUE Offer - Buy 1 Month & Get 3 Months!Click here

Access 7 Analysts Over 200 Markets Covered. Chat Room With Support

CAR-GROUP-4h-asx-cha...


Conclusion:
This Elliott Wave analysis for ASX: CAR GROUP LIMITED (CAR) provides a clear outlook on potential bullish momentum and technical entry levels. Key resistance and support zones are outlined to support traders in verifying wave progress or adjusting their strategies. This insight, grounded in Elliott Wave theory, strengthens the forecast confidence and aids in making informed trading decisions.

Related

NVIDIA Corp. (NVDA) Elliott Wave Analysis: Bullish Trend Outlook, Price Prediction, Technical Analysis, and Wave 3 Projection

NVIDIA Corp. (NVDA) Elliott Wave Analysis: Bullish Trend Outlook, Price Prediction, Technical Analysis, and Wave 3 Projection

This NVIDIA Elliott Wave Analysis provides an in-depth look at NVDA's stock trend, identifying k...

Read More >
South32 Limited Stock Analysis & Elliott Wave Technical Forecast: Critical Validation Points and Includes a Short-Term Forecast

South32 Limited Stock Analysis & Elliott Wave Technical Forecast: Critical Validation Points and Includes a Short-Term Forecast

This analysis provides an in-depth look at ASX: South32 Limited (S32) using Elliott Wave theory. It ...

Read More >
Tesla Inc.(TSLA:NASDAQ) Elliott Wave Technical Analysis 17 November 23

Tesla Inc.(TSLA:NASDAQ) Elliott Wave Technical Analysis 17 November 23

Tesla Inc.(TSLA:NASDAQ) Elliott Wave Technical Analysis 17 November 23 shows TSLA Stock Market Analy...

Read More >
Analysis Provides Insights into Coca-Cola's Stock Forecast using Elliott Wave Theory and Technical Chart Patterns

Analysis Provides Insights into Coca-Cola's Stock Forecast using Elliott Wave Theory and Technical Chart Patterns

In this Coca-Cola (KO) Elliott Wave analysis, we examine the daily and 1-hour charts to evaluate the...

Read More >
Complete Elliott Wave Analysis of McDonald's Corp. (MCD) - Daily and 4Hr Charts

Complete Elliott Wave Analysis of McDonald's Corp. (MCD) - Daily and 4Hr Charts

This comprehensive Elliott Wave analysis of McDonald's Corp. (MCD) on both daily and 4-hour char...

Read More >
NZDUSD Elliott Wave Analysis with Bullish Forecast, Wave Count Structure, and Forex Trading Strategies Explained

NZDUSD Elliott Wave Analysis with Bullish Forecast, Wave Count Structure, and Forex Trading Strategies Explained

Elliott Wave analysis of the NZDUSD pair, highlighting bullish momentum on both the daily and 4-hour...

Read More >

$1 for 2 Weeks

then $29 a month!

What a Special Offer!

Trade Recommendations

Unleash the power of deversified trading with our comprehensive portfolio, covering 250+ markets:

  • Stock Trades
  • Crypto Trades
  • Forex Trades
  • Commodity Trades
Elliott Wave Analysis

Gain a competitive edge with expert insights and AI-powered Elliott Wave charting into:

  • Global Indices
  • US Stocks & ASX Stocks
  • Forex & Crypto
  • Commodities
Top-Notch Trading Tools

Equip yourself with the tools of success:

  • Real-time Chat rooms
  • Elliott Wave Algorithm
  • Portfolio tools
  • TradingLevels
  • Screener
  • Trading Game
7 Elliott Wave Analysts

Stay ahead of the market with daily charts and insightful videos
Your secret to strategic trading!

JOIN HERE


Welcome to TradingLounge (ASIC A.R.No. 321187), specialists in trades, trading education and technical analysis, covering stocks, indices, commodities, forex and cryptocurrencies.

When you join TradingLounge you have access to everything we offer, including trade tools, educational content and a social platform to chat with like-minded investors.

Read more

@Copyright 2024 by tradinglounge.com

Contact Us

Australian no: 02 4787 6020

International no: +61 (2) 47876020

Pay with:

Find us on