06Feb

Learn Whether ANZ Group Holdings Limited Shares are a Buy or Sell – ANZ Elliott Wave Analysis & Technical Forecast

ASX: ANZ GROUP HOLDINGS LIMITED – ANZ Elliott Wave Technical Analysis

Greetings, Traders!

Today's Elliott Wave analysis presents an in-depth look at the Australian Stock Exchange (ASX) focusing on ANZ GROUP HOLDINGS LIMITED (ASX: ANZ).

Our latest analysis indicates that ASX: ANZ is likely to experience further downward movement in the short term. However, once the corrective wave completes, there is a strong likelihood of a bullish continuation with Wave 5.

Key Questions Addressed:

  • Is this the right time to buy ANZ stocks?
  • What is the best approach to entering a position?
  • Where is the optimal buy entry point?

Today's technical breakdown aims to provide clarity on these essential trading decisions.


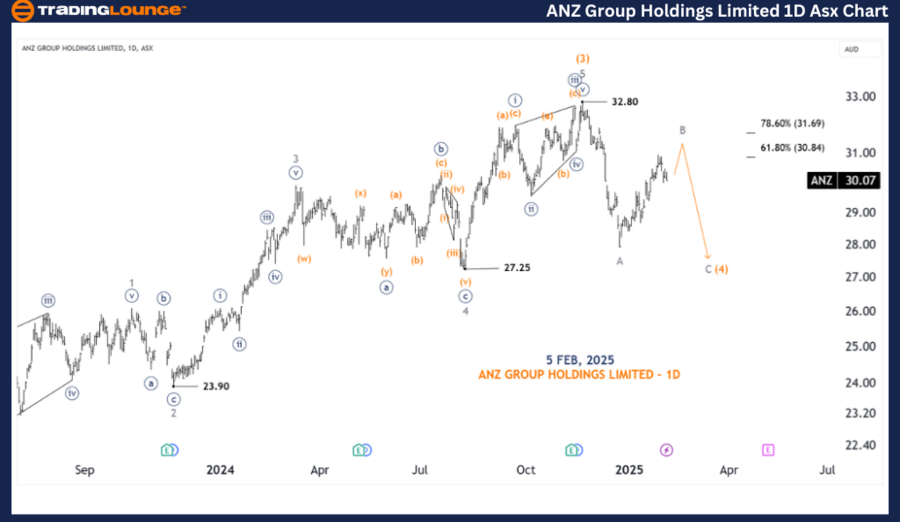
ASX: ANZ GROUP HOLDINGS LIMITED – Elliott Wave Analysis (1D Chart – Semilog Scale)

Market Structure & Wave Count:

Function: Major Trend (Intermediate Degree, Orange)

Mode: Motive

Structure: Impulse

Position: Wave ((b)) – Navy of Wave 4 – Orange

ANZ Stock Analysis & Key Levels:

  • Wave (3) – Orange concluded as a five-wave impulse, reaching a high of 32.80.

  • The price is currently in a corrective phase (Wave 4 – Orange).
  • Wave (4) – Orange is still developing, with further downside likely before completion.
  • The ABC-Grey corrective pattern suggests that Wave B-Grey is nearing its conclusion, and Wave C-Grey may push the price lower.

Critical Level – Invalidation Point:

🚨 Invalidation Level: 32.80 – Any move above this level would invalidate the current wave structure.

ANZ-GROUP-HOLDINGS-L...


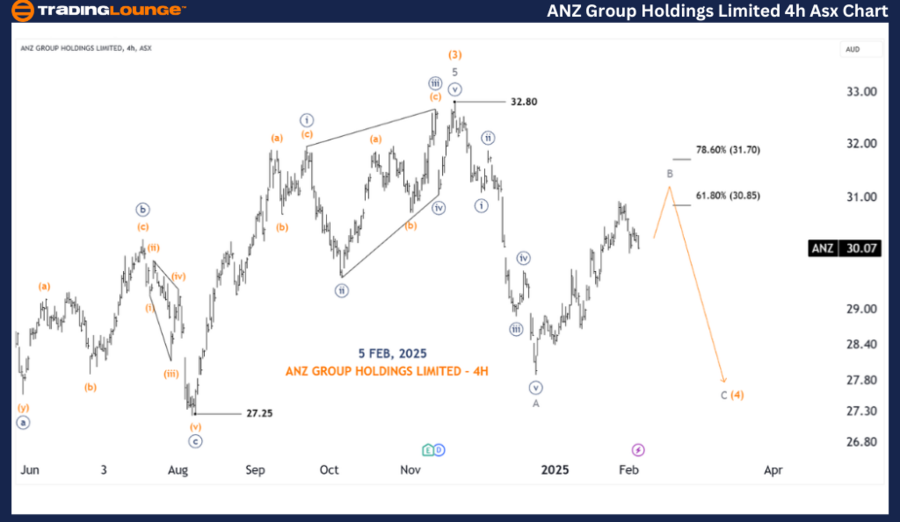
ASX: ANZ Group Holdings Limited – Elliott Wave Analysis (4-Hour Chart Analysis)

Market Structure & Wave Count:

  • Function: Major Trend (Minor Degree, Grey)
  • Mode: Motive
  • Structure: Impulse
  • Position: Wave B-Grey of Wave (4) – Orange

Analysis & Key Levels:

  • Wave A-Grey of Wave (4) – Orange has completed.
  • Wave B-Grey is nearing its end, reaching a key resistance level.
  • Once Wave B-Grey concludes, Wave C-Grey is expected to drive prices lower, finalizing the corrective phase.

Critical Level – Invalidation Point:

🚨 Invalidation Level: 32.80 – A break above this level would require a reassessment of the wave structure.

Technical Analyst: Hua (Shane) Cuong, CEWA-M (Master’s Designation).

Source: visit Tradinglounge.com and learn From the Experts Join TradingLounge Here 

See Previous: SONIC HEALTHCARE LIMITED Elliott Wave Technical Analysis

VALUE Offer - Buy 1 Month & Get 3 Months!Click here

Access 7 Analysts Over 200 Markets Covered. Chat Room With Support

ANZ-GROUP-HOLDINGS-L...


Conclusion

Our Elliott Wave analysis for ASX: ANZ GROUP HOLDINGS LIMITED (ANZ) aims to provide key insights into current market conditions and potential trading opportunities.

By identifying crucial price levels that confirm or invalidate the wave count, traders can enhance their decision-making process with greater confidence.

Leveraging technical expertise and market trends, we provide a professional, data-driven outlook for traders looking to navigate ASX: ANZ effectively.

Related

Bitcoin/U.S. dollar(BTCUSD) Elliott Wave Technical Analysis 31 October 23

Bitcoin/U.S. dollar(BTCUSD) Elliott Wave Technical Analysis 31 October 23

Bitcoin/U.S. dollar(BTCUSD) Elliott Wave Technical Analysis on 31 October 23 with BTCUSD Analysis Da...

Read More >
Avery Dennison Corp. (AVY) Stock Analysis: Elliott Wave Technical  Forecast and Investment Insights for Better Trading Decisions

Avery Dennison Corp. (AVY) Stock Analysis: Elliott Wave Technical Forecast and Investment Insights for Better Trading Decisions

Avery Dennison (AVY) stock, offers insights into technical patterns, potential price movements, and ...

Read More >
Microsoft Corp.(MSFT:NASDAQ)Elliott Wave Technical Analysis 3 November 23

Microsoft Corp.(MSFT:NASDAQ)Elliott Wave Technical Analysis 3 November 23

Trading Lounge Microsoft Corp.(MSFT:NASDAQ) Elliott Wave Technical Analysis on 3 November 23, MSFT S...

Read More >
Maruti Suzuki India Stock Prediction: In-Depth Elliott Wave Technical  Analysis and Market Trends

Maruti Suzuki India Stock Prediction: In-Depth Elliott Wave Technical Analysis and Market Trends

This article provides a detailed Elliott Wave analysis of Maruti Suzuki stock. It covers key technic...

Read More >
Ethereum ETH (ETH-USD) Price Chart Analysis daily | ETHUSD Elliott Wave Technical Analysis daily

Ethereum ETH (ETH-USD) Price Chart Analysis daily | ETHUSD Elliott Wave Technical Analysis daily

Elliott Wave Analysis TradingLounge Daily Chart, 11 October 23 Ethereum/U.S. dollar(ETHUSD) ETHUSD...

Read More >

Buy 1 Month

Get 3 Months!

Special Offer:

Trade Recommendations

Unleash the power of deversified trading with our comprehensive portfolio, covering:

  • Stock Trades
  • Crypto Trades
  • Forex Trades
  • Commodity Trades
Elliott Wave Analysis

Gain a competive edge with expert insights in to:

  • Global Indices
  • US Stocks & ASX Stocks
  • Forex & Crypto
  • Commodities
Top-Notch Trading Tools

Equip yourself with the tools of success:

  • Social Chat
  • Elliott Wave Algorithm
  • Screener
  • TradingLevels
  • Trading Game
7 Elliott Wave Analysts

Stay ahead of the market with daily charts and insightful videos
-Your secret to strategic trading!

JOIN HERE


Welcome to TradingLounge (ASIC A.R.No. 321187), specialists in trades, trading education and technical analysis, covering stocks, indices, commodities, forex and cryptocurrencies.

When you join TradingLounge you have access to everything we offer, including trade tools, educational content and a social platform to chat with like-minded investors.

Read more

@Copyright 2024 by tradinglounge.com

Contact Us

Australian no: 02 4787 6020

International no: +61 (2) 47876020

Pay with:

Find us on