16May

Elliott Wave Analysis for INSURANCE AUSTRALIA GROUP LIMITED – IAG Suggests Downward Movement as B-Grey Wave Completes; Key Target at 7.79

ASX: INSURANCE AUSTRALIA GROUP LIMITED – IAG Elliott Wave Technical Analysis – TradingLounge

Overview:
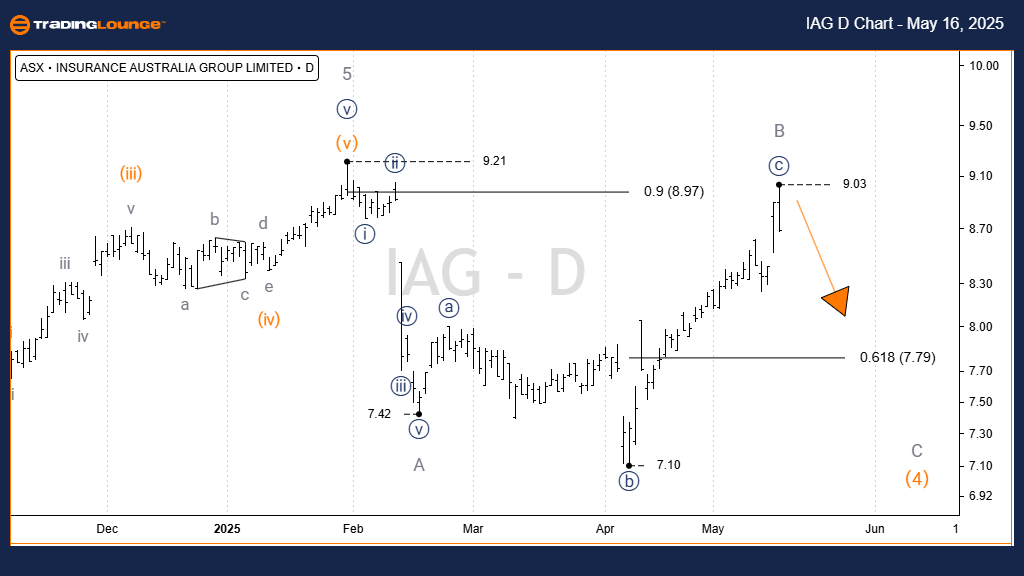
Welcome to today's Elliott Wave analysis for ASX: INSURANCE AUSTRALIA GROUP LIMITED (IAG). Current technical indicators suggest ASX:IAG is nearing the completion of Wave B-grey, potentially transitioning into a downward Wave C. The existing wave structure does not support a bullish scenario, making it a less favorable environment for long positions at this time.


ASX: INSURANCE AUSTRALIA GROUP LIMITED – IAG 1D Chart (Semilog Scale) Analysis

Trend Function: Primary trend (Minor degree, grey)

Wave Mode: Motive

Wave Structure: Impulse

Current Position: Wave C-grey

Key Insights:

  • Wave 3-orange has successfully completed its five-wave impulse pattern.
  • The market is now undergoing a Wave 4-orange correction, unfolding as a Zigzag (A-B-C-grey).
  • Wave A-grey has concluded.
  • Wave B-grey likely ended as an Expanded Flat.
  • Wave C-grey is currently pushing lower with a projected price target near 7.79.
  • Critical Invalidation Level: A move above 9.03 would invalidate the current wave count.

IAG-ASX-Stock-Day-ch...


ASX: INSURANCE AUSTRALIA GROUP LIMITED – IAG Elliott Wave Technical Analysis – TradingLounge (4-Hour Chart)

Trend Function: Major trend (Minor degree, grey)

Wave Mode: Motive

Wave Structure: Impulse

Current Position: Wave C-grey

Detailed Breakdown:

  • Waves A-grey and B-grey are both completed.
  • After peaking at 9.03, the stock has entered a downward leg consistent with Wave C-grey.
  • Primary support target is 7.79, with potential lower zones between 7.42 and 7.10.
  • This scenario is valid only if price remains below the 9.03 invalidation point.

Technical Analyst: Hua (Shane) Cuong, CEWA-M (Master’s Designation).

Source: Visit Tradinglounge.com and learn from the Experts. Join TradingLounge Here 

See Previous: BLOCK, INC – XYZ (SQ2) Elliott Wave Technical Analysis

VALUE Offer - Buy 1 Month & Get 3 Months!Click here

Access 7 Analysts Over 200 Markets Covered. Chat Room With Support

IAG-ASX-Stock-4h-cha...


Conclusion:
Our updated Elliott Wave forecast for ASX: IAG provides a structured view of expected price movements. We highlight both validation and invalidation levels to support confident trading decisions. This analysis aims to offer clear, unbiased technical guidance for traders focused on ASX:IAG’s short-to-medium term trend direction.

Related

Euro/ U.S. Dollar (EURUSD) Elliott Wave Analysis: Market Trends, and Trading Strategy for Forex Traders Using Elliott Wave Theory

Euro/ U.S. Dollar (EURUSD) Elliott Wave Analysis: Market Trends, and Trading Strategy for Forex Traders Using Elliott Wave Theory

EURUSD Elliott Wave Analysis provides a detailed forecast of the Euro/USD currency pair, highlightin...

Read More >
Wheat Commodity Elliott Wave Technical Analysis: Bullish Corrections and Future Price Movements in Wheat Futures

Wheat Commodity Elliott Wave Technical Analysis: Bullish Corrections and Future Price Movements in Wheat Futures

Our latest wheat price forecast for 2024 is based on Elliott Wave analysis, highlighting key market ...

Read More >
Unlock ASX Trading Potential: REA GROUP LTD Stock Analysis & REA Elliott Wave Technical Forecast

Unlock ASX Trading Potential: REA GROUP LTD Stock Analysis & REA Elliott Wave Technical Forecast

Get the latest Elliott Wave analysis for ASX REA Group. Discover key stock trends, wave counts, and ...

Read More >
Binance Wave 3 Breakout: BNBUSD Elliott Wave Analysis and Trading Strategy with Fibonacci Targets and Risk Control Techniques

Binance Wave 3 Breakout: BNBUSD Elliott Wave Analysis and Trading Strategy with Fibonacci Targets and Risk Control Techniques

BNBUSD breaks out of Triangle IV, starting Wave 3 — the strongest trend phase. Learn entry points, ...

Read More >
Unleash Profits: Elliott Wave Analysis & Strategies for SP500, NASDAQ 100, RUSSELL 2000, DAX 40, FTSE 100, ASX 200

Unleash Profits: Elliott Wave Analysis & Strategies for SP500, NASDAQ 100, RUSSELL 2000, DAX 40, FTSE 100, ASX 200

Stock Market Indices Overview: S&P 500, SPY, NASDAQ 100, QQQ, RUSSELL 2000, DAX 40, FTSE 100, ASX 20...

Read More >

$1 for 2 Weeks

then $29 a month!

What a Special Offer!

Trade Recommendations

Unleash the power of deversified trading with our comprehensive portfolio, covering 250+ markets:

  • Stock Trades
  • Crypto Trades
  • Forex Trades
  • Commodity Trades
Elliott Wave Analysis

Gain a competitive edge with expert insights and AI-powered Elliott Wave charting into:

  • Global Indices
  • US Stocks & ASX Stocks
  • Forex & Crypto
  • Commodities
Top-Notch Trading Tools

Equip yourself with the tools of success:

  • Real-time Chat rooms
  • Elliott Wave Algorithm
  • Portfolio tools
  • TradingLevels
  • Screener
  • Trading Game
7 Elliott Wave Analysts

Stay ahead of the market with daily charts and insightful videos
Your secret to strategic trading!

JOIN HERE


Welcome to TradingLounge (ASIC A.R.No. 321187), specialists in trades, trading education and technical analysis, covering stocks, indices, commodities, forex and cryptocurrencies.

When you join TradingLounge you have access to everything we offer, including trade tools, educational content and a social platform to chat with like-minded investors.

Read more

@Copyright 2024 by tradinglounge.com

Contact Us

Australian no: 02 4787 6020

International no: +61 (2) 47876020

Pay with:

Find us on