Gold Elliott Wave Analysis - trapped in a range. Where will it break out?
Gold (XAUUSD) Elliott Wave Technical Analysis
Function - Counter-trend
Mode - Corrective
Structure - Zigzag
Position - Blue wave D of IV
Direction - Blue wave E of IV
Gold has exhibited a consolidated phase spanning the last three months, indicating a period of range-bound movement. However, this consolidation does not disrupt the overarching long-term trend that has persisted since 2015. Anticipation mounts that once gold breaks free from this range, it may surge to establish a fresh all-time high, thus reinforcing its enduring bullish trajectory.
Gold (XAUUSD) Day Chart Analysis
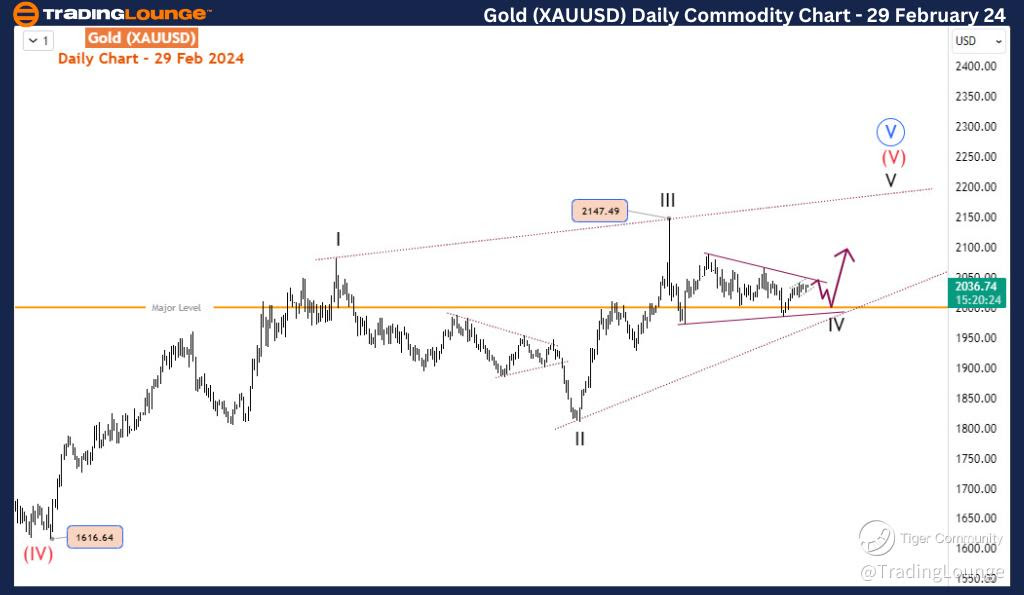
Zooming into the daily time frame, scrutiny intensifies on the unfolding dynamics of the red wave (5) within the larger context of blue wave V. Commencing its development from 1616 in November 2022, wave (5) appears to be manifesting into an ending diagonal pattern. While wave I-II-III of (V) have seemingly concluded, wave IV's trajectory has morphed into a sideways movement, resembling a triangle pattern. This wave IV commenced at 2147, with the triangle formation centering around the significant 2000 level. Should the immediate descent from 2147 align with the presumed triangle scenario, the 2000 level is poised to act as a pivotal support, potentially propelling a bullish breakout towards the 2100-2200 range.

Conversely, a breach below 2000 and the lower boundary of the triangle would signify a different interpretation, suggesting the immediate decline from III as the initial leg of wave IV, thus paving the way for further downward movements. Simplifying the analysis, the preference leans towards the former scenario. Delving into the H4 chart, detailed labeling of the sub-waves comprising wave IV sheds further light on the unfolding pattern.
Gold (XAUUSD) 4H Chart Analysis
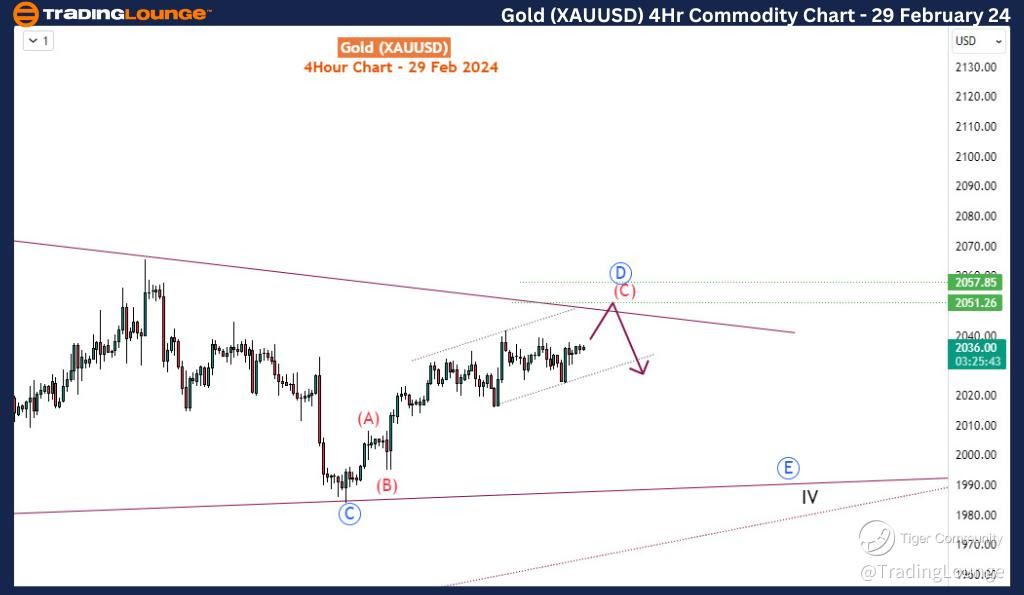
Observing the H4 chart, blue wave D nears its culmination, likely targeting the 2051-2057 supply zone or slightly below. A potential final upswing may transpire before a subsequent breakdown occurs. Should such a breakdown materialize, wave E could emerge, setting its sights on revisiting the critical 2000 level once more, completing the anticipated wave IV correction cycle.
Technical Analyst: Sanmi Adeagbo
Source: visit Tradinglounge.com and learn From the Experts Join TradingLounge Here
See Previous: Copper Commodity
TradingLounge Once Off SPECIAL DEAL: Here > 1 month Get 3 months.
