NZDUSD Elliott Wave Analysis – Trading Lounge Daily Chart
New Zealand Dollar/US Dollar (NZDUSD) Daily Chart Analysis
NZDUSD Elliott Wave Technical Forecast Based on Elliott Wave Theory
FUNCTION: Bullish Trend
MODE: Impulsive
STRUCTURE: Orange Wave 3
POSITION: Navy Blue Wave 1
NEXT LOWER DEGREE DIRECTION: Orange Wave 4
WAVE INVALIDATION LEVEL: 0.54866
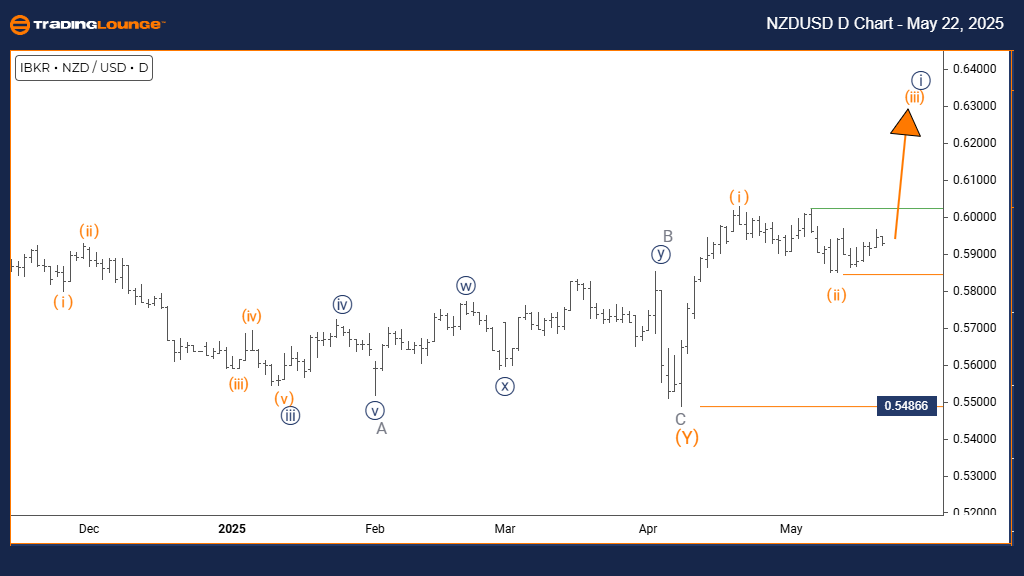
The daily Elliott Wave chart for NZDUSD shows a confirmed bullish trend, with orange wave 3 currently unfolding within navy blue wave 1. Following the completion of the corrective orange wave 2, the market has entered a powerful impulsive phase, typically associated with stronger buying activity. This Elliott Wave setup signals the potential for further gains in the NZDUSD currency pair.
The conclusion of orange wave 2 confirms that the pair is now advancing through orange wave 3. The impulsive nature of this wave reflects increased demand and market momentum. As this third wave continues, traders should anticipate sustained bullish behavior, eventually leading into a corrective orange wave 4. This aligns with classic Elliott Wave formations seen during strong trends.
This analysis highlights NZDUSD’s position within a larger upward market cycle. The completion of orange wave 3 is expected to offer additional upward price action before a likely correction. Traders should monitor technical indicators and volume spikes that often emerge toward the end of impulsive waves. These signals can help anticipate the onset of wave 4, enhancing timing for trade entries and exits.
The daily chart setup supports strategic position management within the current bullish phase. As orange wave 3 progresses, the potential for extended gains remains high, though traders are advised to remain alert for early signs of exhaustion. With the invalidation level at 0.54866, the broader trend remains valid unless this key support is breached.
New Zealand Dollar/US Dollar (NZDUSD) 4-Hour Chart
Elliott Wave Forecast for NZDUSD – 4H Chart Analysis
FUNCTION: Bullish Trend
MODE: Impulsive
STRUCTURE: Orange Wave 3
POSITION: Navy Blue Wave 1
NEXT HIGHER DEGREE DIRECTION: Orange Wave 3 (In Progress)
WAVE INVALIDATION LEVEL: 0.54866
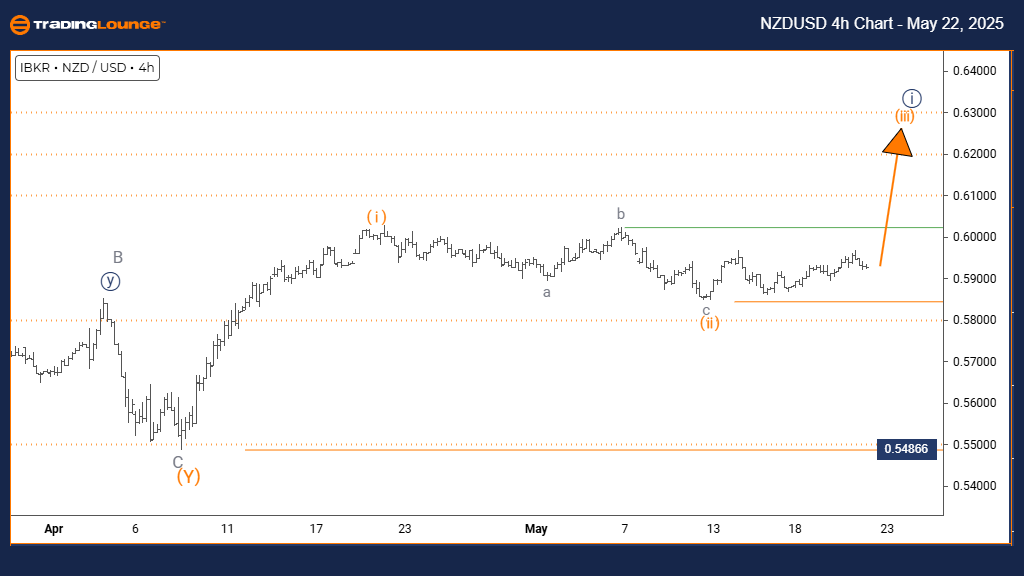
The 4-hour Elliott Wave analysis for NZDUSD continues to reflect strong bullish momentum. This timeframe identifies orange wave 3 as a key component within the broader impulsive structure, navy blue wave 1. The completion of orange wave 2 suggests that the pair is now experiencing a vigorous upward move consistent with the traits of wave 3 in Elliott Wave theory.
Current price behavior confirms the transition from orange wave 2 into orange wave 3. This impulse wave is known for extended rallies, and the chart pattern supports continued bullish sentiment. The invalidation level remains critical at 0.54866—any movement below this point would challenge the existing wave count and imply potential corrective complexity or trend reversal.
This mid-term wave analysis gives traders vital context for understanding NZDUSD’s progression within a long-term bullish phase. As wave 3 continues to unfold, the potential for additional upward momentum remains favorable. However, traders should also prepare for the eventual emergence of wave 4, which will mark the corrective stage of this sequence.
From a trade management perspective, this 4-hour view offers actionable insights. While the trend remains upward, disciplined risk control is essential due to the extended nature of wave 3. Monitoring key support levels and technical indicators can help ensure alignment with the prevailing bullish trend, with the invalidation level serving as a pivotal risk threshold.
Technical Analyst: Malik Awais
Source: Visit Tradinglounge.com and learn from the Experts. Join TradingLounge Here
Previous: USDCAD Elliott Wave Technical Analysis
VALUE Offer - Buy 1 Month & Get 3 Months!Click here
Access 7 Analysts Over 200 Markets Covered. Chat Room With Support
Key Takeaways for NZDUSD Elliott Wave Traders:
- Current trend remains bullish on both daily and 4-hour charts.
- Orange wave 3 is actively advancing, confirming impulse strength.
- Key invalidation level: 0.54866 — a breach would negate the current count.
- Traders should monitor momentum and volume for signs of wave 3 exhaustion.
- Strategic trade management advised as wave 4 correction may follow.