19Feb

ASX CSL LIMITED Elliott Wave Technical Analysis: CSL Stock Prediction, Share Price Trends for CSL Limited Investors

ASX: CSL LIMITED – Elliott Wave Analysis & Forecast | TradingLounge

Greetings, Traders!

Today's Elliott Wave analysis delivers the latest insights on CSL LIMITED (ASX: CSL), a key stock on the Australian Stock Exchange (ASX).

A significant bullish wave expansion appears to be developing in the third wave of ASX: CSL. This analysis identifies potential trend reversals and key price levels that could confirm when the bullish trend strengthens.


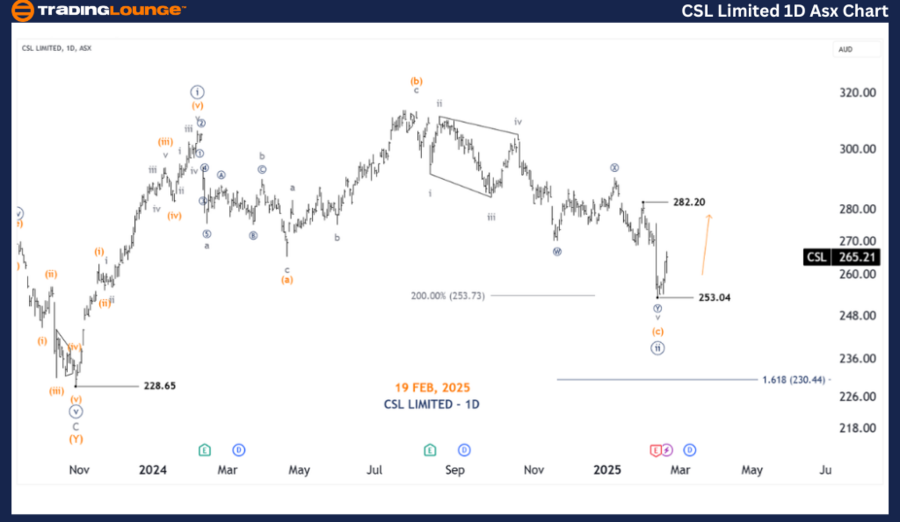
ASX: CSL LIMITED – Elliott Wave Technical Analysis (1D Chart – Semilog Scale)

Market Function: Major Trend (Minute Degree, Navy)

  • Wave Mode: Motive
  • Wave Structure: Impulse
  • Current Position: Wave ((iii)) - Navy

Key Analysis Details:

  • Wave ((ii)) - Navy appears to be forming a Flat correction (a)(b)(c) - Orange, signaling a possible completion.
  • Wave ((iii)) - Navy must break above 282.20 to confirm the bullish outlook.
  • Invalidation Point: 282.20
  • Confirmation Point: 282.20

CSL-LIMITED-1d-asx-c...


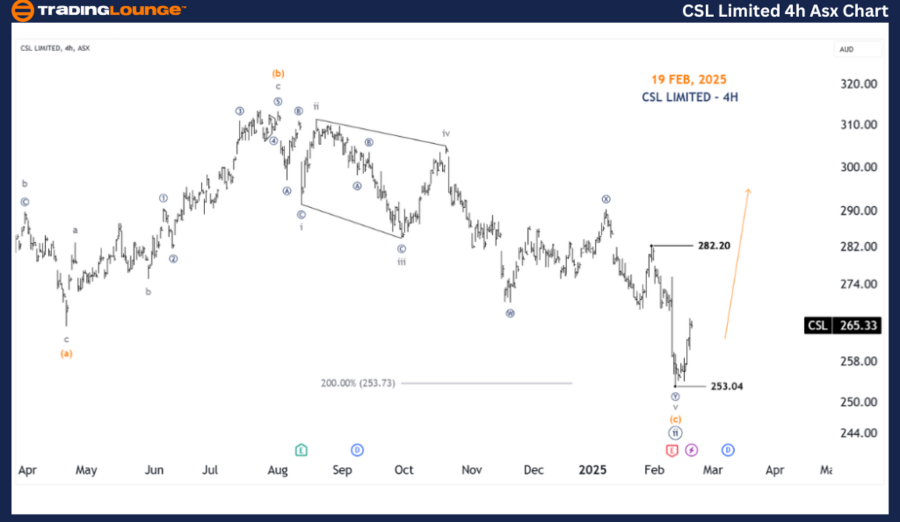
ASX: CSL LIMITED – Elliott Wave Technical Analysis (4-Hour Chart) | TradingLounge

Market Function: Major Trend (Minute Degree, Navy)

  • Wave Mode: Motive
  • Wave Structure: Impulse
  • Current Position: Wave ((iii)) - Navy

Key Analysis Details:

  • The ((ii)) - Navy wave found support at 253.04.
  • A new ((iii)) - Navy wave could be emerging from this level.
  • Breakout Level: A break above 282.20 would validate the bullish trend and indicate strong upside potential.
  • Invalidation Point: 253.04

Technical Analyst: Hua (Shane) Cuong, CEWA-M (Master’s Designation).

Source: visit Tradinglounge.com and learn From the Experts Join TradingLounge Here 

See Previous: ASX LIMITED Elliott Wave Technical Analysis

VALUE Offer - Buy 1 Month & Get 3 Months!Click here

Access 7 Analysts Over 200 Markets Covered. Chat Room With Support

CSL-LIMITED-4h-asx-c...


Conclusion

Our Elliott Wave forecast on ASX: CSL LIMITED (CSL) presents a detailed trend outlook, highlighting key price levels and potential entry points for traders.

By providing specific validation and invalidation signals, we enhance confidence in our wave count. This technical analysis combines critical price action levels with an objective market forecast to guide traders in making informed decisions.

Related

Ripple (XRP) Crypto Price News Today and XRPUSD Elliott Wave Technical Analysis: XRP Price Forecast and Trading Strategy

Ripple (XRP) Crypto Price News Today and XRPUSD Elliott Wave Technical Analysis: XRP Price Forecast and Trading Strategy

XRPUSD is completing a Wave 2 A-B-C correction. Watch for bullish signals around $1.90–$1.88 to ent...

Read More >
BRAMBLES LIMITED - BXB Stock Analysis: Elliott Wave Forecast, Key Price Levels, and ASX Trading Insights for Success

BRAMBLES LIMITED - BXB Stock Analysis: Elliott Wave Forecast, Key Price Levels, and ASX Trading Insights for Success

BRAMBLES LIMITED (ASX:BXB) highlights the potential upward momentum of the ((3))-navy wave. Key insi...

Read More >
Nikkei 225 Index Elliott Wave Technical Analysis: Timely Updates, Expert Forecasts, and Recommended N225 investment tips

Nikkei 225 Index Elliott Wave Technical Analysis: Timely Updates, Expert Forecasts, and Recommended N225 investment tips

Dive into a comprehensive Elliott Wave analysis of the Nikkei 225 (N225) with insights on bullish tr...

Read More >
Detailed insights into Nvidia Corp.(NVDA) Stocks Elliott Wave Technical Analysis Covering daily and 4-hour charts

Detailed insights into Nvidia Corp.(NVDA) Stocks Elliott Wave Technical Analysis Covering daily and 4-hour charts

This article provides an in-depth NVDA Elliott Wave Analysis for Nvidia Corp., covering daily and 4-...

Read More >
Amcor PLC (ASX:AMC) Elliott Wave Analysis Forecasts Potential Wave 3 Breakout with Price Targets, Invalidation Levels

Amcor PLC (ASX:AMC) Elliott Wave Analysis Forecasts Potential Wave 3 Breakout with Price Targets, Invalidation Levels

Amcor PLC (ASX:AMC) technical report analyzes using Elliott Wave theory, forecasting a potential Wav...

Read More >
New Zealand Dollar/U.S.Dollar (NZDUSD) Chart Elliott Wave Technical Analysis 27 October 23

New Zealand Dollar/U.S.Dollar (NZDUSD) Chart Elliott Wave Technical Analysis 27 October 23

In summary, the NZD/USD Elliott Wave Analysis for the Day Chart on 27 October 23, offers substantial...

Read More >

$1 for 2 Weeks

then $29 a month!

What a Special Offer!

Trade Recommendations

Unleash the power of deversified trading with our comprehensive portfolio, covering 250+ markets:

  • Stock Trades
  • Crypto Trades
  • Forex Trades
  • Commodity Trades
Elliott Wave Analysis

Gain a competitive edge with expert insights and AI-powered Elliott Wave charting into:

  • Global Indices
  • US Stocks & ASX Stocks
  • Forex & Crypto
  • Commodities
Top-Notch Trading Tools

Equip yourself with the tools of success:

  • Real-time Chat rooms
  • Elliott Wave Algorithm
  • Portfolio tools
  • TradingLevels
  • Screener
  • Trading Game
7 Elliott Wave Analysts

Stay ahead of the market with daily charts and insightful videos
Your secret to strategic trading!

JOIN HERE


Welcome to TradingLounge (ASIC A.R.No. 321187), specialists in trades, trading education and technical analysis, covering stocks, indices, commodities, forex and cryptocurrencies.

When you join TradingLounge you have access to everything we offer, including trade tools, educational content and a social platform to chat with like-minded investors.

Read more

@Copyright 2024 by tradinglounge.com

Contact Us

Australian no: 02 4787 6020

International no: +61 (2) 47876020

Pay with:

Find us on