16Apr

Salesforce Inc. (CRM) Elliott Wave Analysis: Forecasting Salesforce's (CRM) Market Dynamics and Upcoming Opportunities

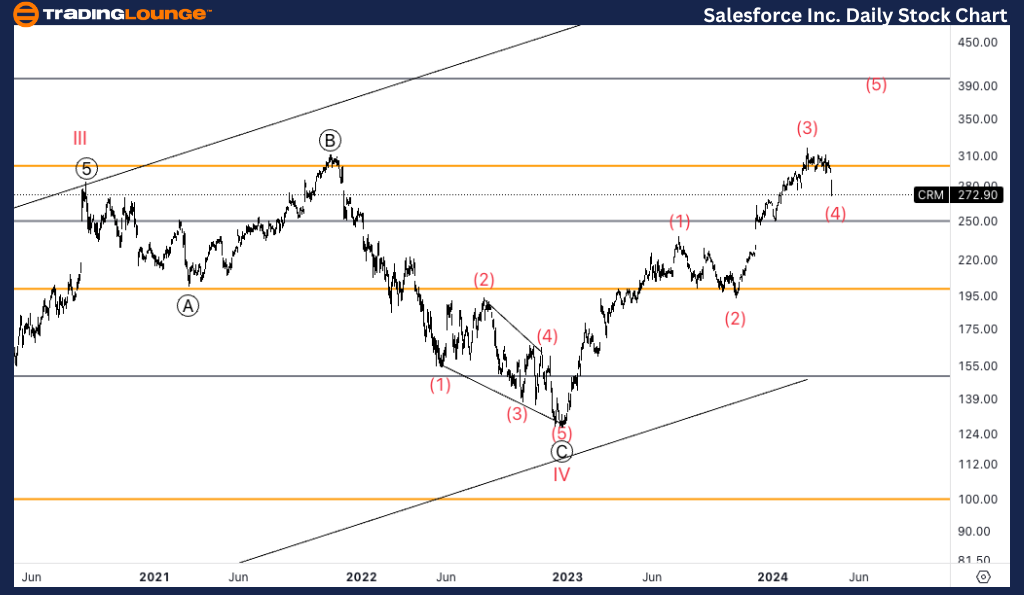
CRM Elliott Wave Analysis Trading Lounge Daily Chart,

Salesforce Inc., (CRM) Daily Chart

CRM Elliott Wave Technical Analysis

FUNCTION: Counter Trend

MODE: Corrective

STRUCTURE: Flat

POSITION: Intermediate wave (4)

DIRECTION: Bottom in wave (4).

DETAILS: We are reacting off TL3 at 300$, in what we labelled as wave (3) of Primary 1. We experienced a long-term correction in wave IV which appears to be complete, and we are now looking for continuation higher.
Salesforce-Inc-daily...


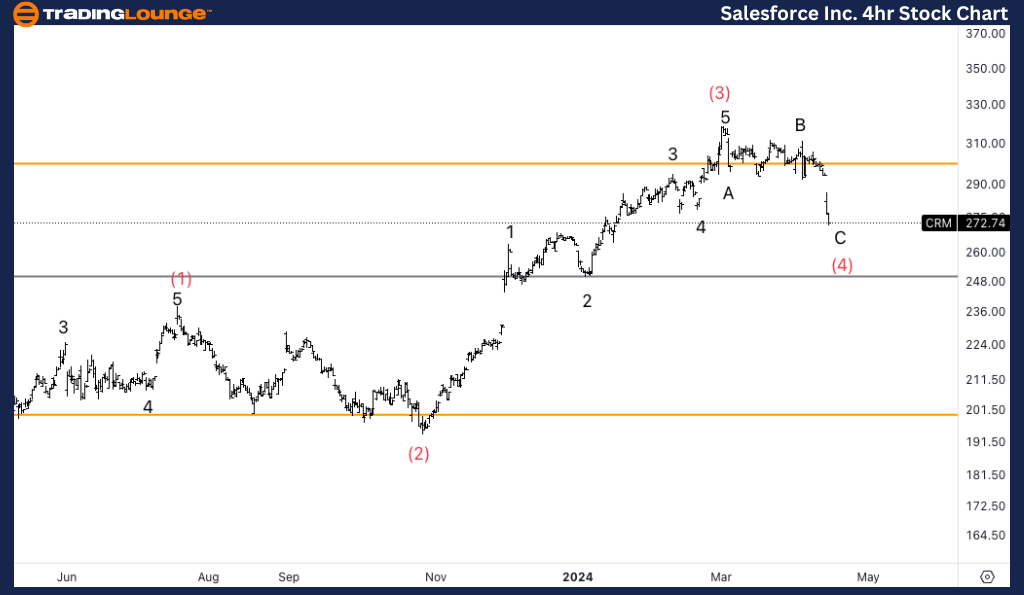
CRM Elliott Wave Analysis Trading Lounge 4Hr Chart,

Salesforce Inc., (CRM) 4H Chart

CRM Elliott Wave Technical Analysis

FUNCTION: Counter Trend

MODE: Corrective

STRUCTURE: Flat

POSITION: Wave C of (4).

DIRECTION: Bottom in wave C.

DETAILS: We seem to have a three-wave move so far in wave (4), with a sideways wave B which because of its characteristics it gives us additional confidence we could be in a corrective structure.

Here's the latest on Salesforce Inc. (CRM) from our Elliott Wave Analysis Trading Lounge, examining both the daily and 4-hour charts.

CRM Elliott Wave Technical Analysis – Daily Chart Salesforce is currently exhibiting behavior typical of a counter-trend phase with a corrective mode and flat structure, positioned in an Intermediate wave (4). The direction is indicating a potential bottom in wave (4). We've observed a reaction off the key level, TL3 at $300, which we have identified as wave (3) of Primary 1. Following a prolonged correction in wave IV, which now appears complete, the outlook suggests a potential continuation higher.

CRM Elliott Wave Technical Analysis – 4hr Chart The 4-Hour chart further supports the daily findings but focuses on the specifics of the ongoing correction in Wave C of (4). This phase is also characterized as counter trend, corrective, and flat. The chart shows a three-wave structure for wave (4), with a sideways wave B. The nature of wave B provides additional confidence that we are indeed in a corrective structure, setting up expectations for a bottom in wave C.

Technical Analyst: Alessio Barretta

Source: visit Tradinglounge.com and learn From the Experts Join TradingLounge Here 

See Previous: Texas Instruments Inc. (TXN) Stock Analysis

TradingLounge Once Off SPECIAL DEAL: Here > 1 month Get 3 months.

TradingLounge's Free Week Extravaganza!

April 14 – 21: Unlock the Doors to Trading Excellence — Absolutely FREE
Salesforce-Inc-4hr-s...

Related

ANZ stock performance with Technical Analysis and Price Targets: Elliott Wave Analysis for ANZ Group Holdings Limited

ANZ stock performance with Technical Analysis and Price Targets: Elliott Wave Analysis for ANZ Group Holdings Limited

Our comprehensive Elliott Wave analysis for ANZ Group Holdings Limited on the Australian Stock Excha...

Read More >
KOSPI Composite Index Elliott Wave Technical Analysis shows Bullish Trend Currently on both Daily and Weekly Charts

KOSPI Composite Index Elliott Wave Technical Analysis shows Bullish Trend Currently on both Daily and Weekly Charts

The KOSPI Composite is currently in a bullish trend, supported by Elliott Wave analysis on both dail...

Read More >
Elliott Wave analysis of Commonwealth Bank of Australia (CBA) Stock Provides Insights into the Current Market trends on the ASX

Elliott Wave analysis of Commonwealth Bank of Australia (CBA) Stock Provides Insights into the Current Market trends on the ASX

This comprehensive Elliott Wave analysis of Commonwealth Bank of Australia (CBA) stock provides insi...

Read More >
Both daily and weekly charts highlight the DAX (Germany) Index Elliott Wave Technical Analysis

Both daily and weekly charts highlight the DAX (Germany) Index Elliott Wave Technical Analysis

The DAX (Germany) Elliott Wave Analysis provides comprehensive insights into current market trends u...

Read More >
Stay informed about Wheat Commodity Market with Wheat Elliott Wave Technical Analysis

Stay informed about Wheat Commodity Market with Wheat Elliott Wave Technical Analysis

Our detailed wheat Elliott Wave analysis provides insights into wheat price forecasts and market tre...

Read More >
Looking to Invest in Nikkei 225 ETFs, Index Funds, or Individual Stocks: N225 Index Elliott Wave Technical Analysis

Looking to Invest in Nikkei 225 ETFs, Index Funds, or Individual Stocks: N225 Index Elliott Wave Technical Analysis

Stay ahead in the Nikkei 225 market with expert trading insights and analysis. This comprehensive gu...

Read More >

Buy 1 Month

Get 3 Months!

Special Offer:

Trade Recommendations

Unleash the power of deversified trading with our comprehensive portfolio, covering:

  • Stock Trades
  • Crypto Trades
  • Forex Trades
  • Commodity Trades
Elliott Wave Analysis

Gain a competive edge with expert insights in to:

  • Global Indices
  • US Stocks & ASX Stocks
  • Forex & Crypto
  • Commodities
Top-Notch Trading Tools

Equip yourself with the tools of success:

  • Social Chat
  • Elliott Wave Algorithm
  • Screener
  • TradingLevels
  • Trading Game
7 Elliott Wave Analysts

Stay ahead of the market with daily charts and insightful videos
-Your secret to strategic trading!

JOIN HERE


Welcome to TradingLounge (ASIC A.R.No. 321187), specialists in trades, trading education and technical analysis, covering stocks, indices, commodities, forex and cryptocurrencies.

When you join TradingLounge you have access to everything we offer, including trade tools, educational content and a social platform to chat with like-minded investors.

Read more

@Copyright 2024 by tradinglounge.com

Contact Us

Australian no: 02 4787 6020

International no: +61 (2) 47876020

Pay with:

Find us on