21Jan

Elliott Wave Analysis of Westpac Banking Corporation (WBC) – ASX Stock Forecast, Key Price Levels, and Investment Insights

ASX: WESTPAC BANKING CORPORATION - WBC Elliott Wave Technical Analysis | TradingLounge

Greetings, our latest Elliott Wave analysis for the Australian Stock Exchange (ASX) focuses on WESTPAC BANKING CORPORATION (ASX: WBC). Our technical evaluation suggests that ASX: WBC may have completed a Triangle pattern, positioning the stock for potential upward movement on Thursday. This analysis outlines key price levels that can confirm or invalidate this perspective and highlight when a bullish trend confirmation is likely.


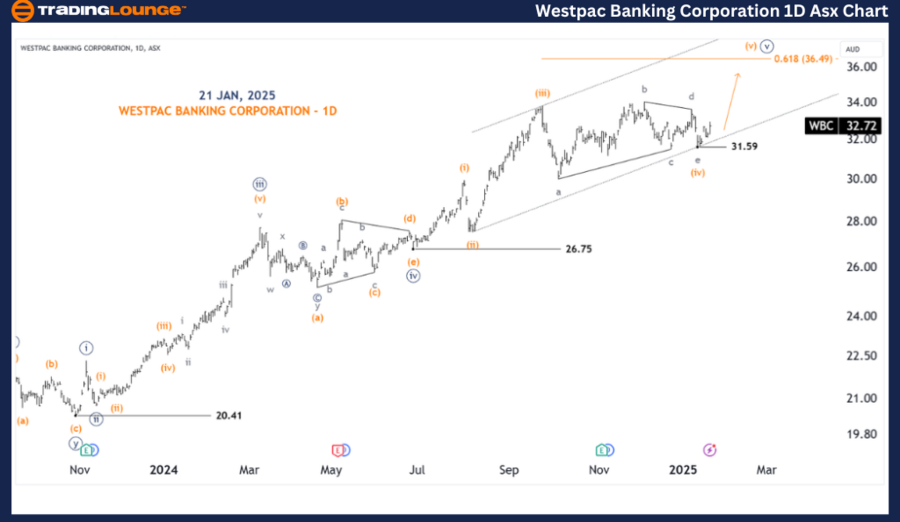
ASX: WESTPAC BANKING CORPORATION - WBC 1D Chart (Semilog Scale) Analysis

Function: Major trend (Minute degree, navy)

Mode: Motive

Structure: Impulse

Position: Wave (v)-orange of Wave ((v))-navy

Key Insights:

We observe a completed Triangle pattern, with the fourth wave reaching a low of 31.59, followed by the formation of the (v)-orange wave, which is expected to push higher. The price target is around 36.49, or potentially the upper boundary of the price channel. However, the price must stay above 31.59 to validate this outlook.

  • Invalidation point: 31.59

WESTPAC-BANKING-CORP...


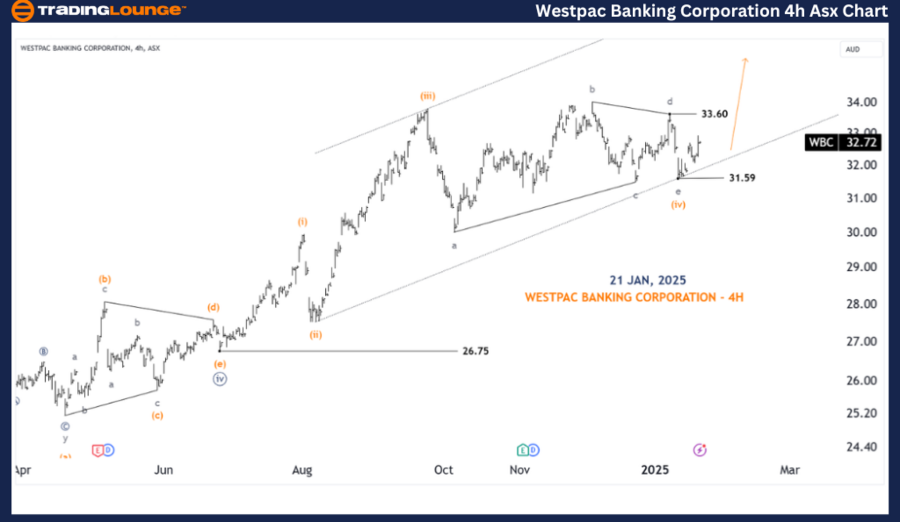
ASX: WESTPAC BANKING CORPORATION - WBC 4-Hour Chart Analysis

Function: Major trend (Minor degree, grey)

Mode: Motive

Structure: Impulse

Position: Wave (v)-orange

Key Insights:

Recent price action confirms that the push above 33.60, marking the end of the d-grey wave in the Triangle pattern, strengthens the case for a completed formation. The subsequent fifth wave is anticipated to unfold, further supporting the bullish outlook.

  • Invalidation point: 31.59
  • Confirmation point: 33.60

Technical Analyst: Hua (Shane) Cuong, CEWA-M (Master’s Designation).

Source: visit Tradinglounge.com and learn From the Experts Join TradingLounge Here 

See Previous: LIGHT & WONDER INC. – LNW Elliott Wave Technical Analysis

VALUE Offer - Buy 1 Month & Get 3 Months!Click here

Access 7 Analysts Over 200 Markets Covered. Chat Room With Support

WESTPAC-BANKING-CORP...


Conclusion

Our Elliott Wave analysis and forecast for ASX: WESTPAC BANKING CORPORATION (WBC) provide valuable insights into current market conditions and actionable strategies. The outlined price levels serve as essential validation and invalidation references for the wave count, increasing confidence in our perspective. By leveraging these insights, traders and investors can better navigate market movements with an informed, professional approach.

Related

COLES GROUP LIMITED – COL Elliott Wave Technical Analysis Reveals Bullish Breakout Signal with Wave iii Targeting $30 on ASX Chart

COLES GROUP LIMITED – COL Elliott Wave Technical Analysis Reveals Bullish Breakout Signal with Wave iii Targeting $30 on ASX Chart

Coles Group Limited (ASX: COL) uses Elliott Wave principles to outline potential bullish scenarios. ...

Read More >
Wheat Elliott Wave Technical Analysis: Latest Price Forecast, Market Trends, and Trading Strategy for 2025 Commodity Futures

Wheat Elliott Wave Technical Analysis: Latest Price Forecast, Market Trends, and Trading Strategy for 2025 Commodity Futures

Wheat is nearing the completion of a long-term bearish impulse wave, with a potential multi-week or ...

Read More >
Predicting HDFC Bank’s Stock Movement and Identifying Key Target Levels using HDFCBANK Elliott Wave Technical Analysis

Predicting HDFC Bank’s Stock Movement and Identifying Key Target Levels using HDFCBANK Elliott Wave Technical Analysis

This analysis of HDFC Bank stock provides an in-depth look at its current trend using Elliott Wave t...

Read More >
Elliott Wave Insights & Strategies SP500, NASDAQ, DAX 40, FTSE 100, ASX200

Elliott Wave Insights & Strategies SP500, NASDAQ, DAX 40, FTSE 100, ASX200

Elliott Wave Analysis Update: Gain insight into market trends and timing with our analysis of the El...

Read More >
TASI Index Elliott Wave Technical Analysis to understand Stock Market trends, Market Momentum, and impulsive waves

TASI Index Elliott Wave Technical Analysis to understand Stock Market trends, Market Momentum, and impulsive waves

Dive into the TASI Index Elliott Wave analysis to understand stock market trends, corrective phases,...

Read More >
Cardano Crypto Price News Today: Our Detailed Elliott Wave Technical Analysis ADAUSD Provides Detailed Insights

Cardano Crypto Price News Today: Our Detailed Elliott Wave Technical Analysis ADAUSD Provides Detailed Insights

Our detailed Elliott Wave Analysis for Cardano (ADAUSD) provides comprehensive insights into price p...

Read More >

$1 for 2 Weeks

then $29 a month!

What a Special Offer!

Trade Recommendations

Unleash the power of deversified trading with our comprehensive portfolio, covering 250+ markets:

  • Stock Trades
  • Crypto Trades
  • Forex Trades
  • Commodity Trades
Elliott Wave Analysis

Gain a competitive edge with expert insights and AI-powered Elliott Wave charting into:

  • Global Indices
  • US Stocks & ASX Stocks
  • Forex & Crypto
  • Commodities
Top-Notch Trading Tools

Equip yourself with the tools of success:

  • Real-time Chat rooms
  • Elliott Wave Algorithm
  • Portfolio tools
  • TradingLevels
  • Screener
  • Trading Game
7 Elliott Wave Analysts

Stay ahead of the market with daily charts and insightful videos
Your secret to strategic trading!

JOIN HERE


Welcome to TradingLounge (ASIC A.R.No. 321187), specialists in trades, trading education and technical analysis, covering stocks, indices, commodities, forex and cryptocurrencies.

When you join TradingLounge you have access to everything we offer, including trade tools, educational content and a social platform to chat with like-minded investors.

Read more

@Copyright 2024 by tradinglounge.com

Contact Us

Australian no: 02 4787 6020

International no: +61 (2) 47876020

Pay with:

Find us on