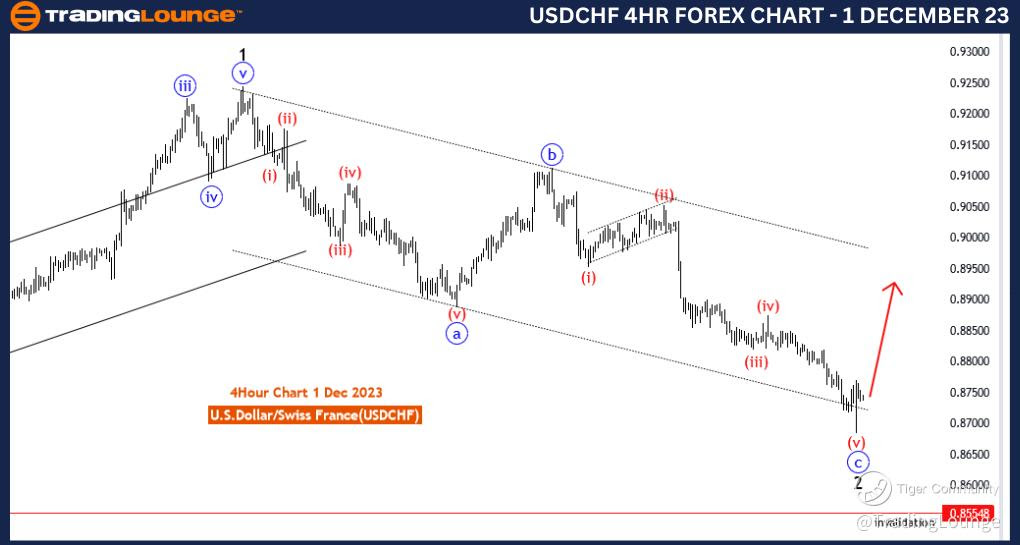
USDCHF Elliott Wave Analysis Trading Lounge 4 Hour Chart, 1 December 23
U.S.Dollar/Swiss Franc(USDCHF) 4 Hour Chart
USDCHF Elliott Wave Technical Analysis
Function: Trend
Mode: impulsive
Structure: blue wave 1
Position: Black wave 3
Direction Next Higher Degrees: Blue wave 1(may started)
Details: red wave 5 blue wave C of 2 looking completed between fib level 61.80 to 78.60 .Now blue wave 1 of 3 is in play . Wave Cancel invalid level: 0.85548
The "USDCHF Elliott Wave Analysis Trading Lounge 4 Hour Chart" dated 1 December 23, delves into the intricacies of the U.S. Dollar/Swiss Franc (USDCHF) currency pair within a four-hour timeframe. The analysis employs Elliott Wave principles to decipher the market's structure and potential future movements.
The identified "Function" of this analysis is "Trend," indicating a focus on determining and understanding the prevailing trend in the market. This suggests that the primary objective is to identify directional movements that could guide traders in making informed decisions.
The specified "Mode" is "impulsive," suggesting that the market is currently exhibiting characteristics of an impulsive wave. Impulsive waves are typically associated with strong directional movements in the market, indicating a potential trend in progress.
The primary "Structure" under examination is "blue wave 1," implying that the focus is on the initial wave within a larger Elliott Wave structure. In this context, the analysis aims to capture the early stages of what could be a significant market movement.
The designated "Position" is "Black wave 3," signifying the broader-degree wave within the Elliott Wave structure. This suggests that the analysis is conducted with a broader perspective, considering the potential third wave within a larger degree of trend.
The directional guidance for "Next Higher Degrees" is "Blue wave 1 (may have started)," indicating the anticipation of the commencement of a potential larger-degree trend. This aligns with the impulsive mode, suggesting a strong move in the upward direction.
Regarding "Details," the analysis notes that "red wave 5 blue wave C of 2 looking completed between fib level 61.80 to 78.60." This provides traders with a specific range of Fibonacci retracement levels within which the completion of the previous corrective wave is expected.
The "Wave Cancel invalid level" is set at 0.85548, serving as a crucial reference point for potential invalidation of the current wave count. Traders can use this level as a guide for confirmation or reversal signals.
In conclusion, the USDCHF Elliott Wave Analysis on the 4-hour chart suggests the potential beginning of an impulsive wave (blue wave 1) after the completion of a corrective phase. Traders are provided with insights into specific Fibonacci levels and a key reference point for potential trend reversals or confirmations.
Technical Analyst: Malik Awais
Source: Tradinglounge.com get trial here!
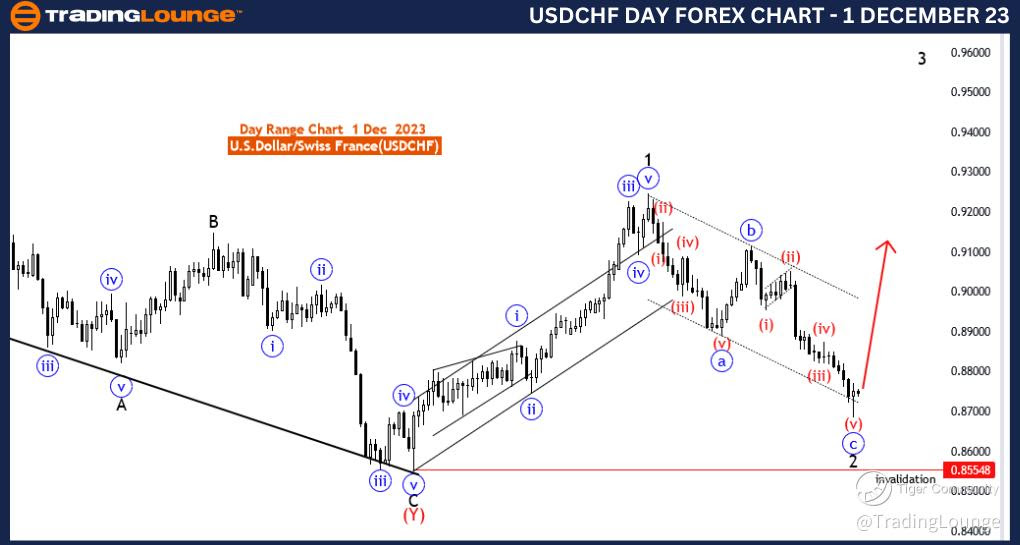
USDCHF Elliott Wave Analysis Trading Lounge Day Chart, 1 December 23
U.S.Dollar/Swiss Franc(USDCHF) Day Chart
USDCHF Elliott Wave Technical Analysis
Function: Trend
Mode: impulsive
Structure: blue wave 1
Position: Black wave 3
Direction Next Higher Degrees: Blue wave 1(may started)
Details: red wave 5 blue wave C of 2 looking completed between fib level 61.80 to 78.60 .Now blue wave 1 of 3 is in play . Wave Cancel invalid level: 0.85548
The "USDCHF Elliott Wave Analysis Trading Lounge Day Chart" for 1 December 23, provides a detailed examination of the U.S. Dollar/Swiss Franc (USDCHF) currency pair within a daily timeframe, utilizing Elliott Wave principles for technical analysis.
The analysis identifies the primary "Function" as "Trend," indicating a focus on discerning and comprehending the prevailing trend in the market. This suggests an emphasis on understanding the directional movements that could guide traders in their decision-making.
The specified "Mode" is "impulsive," suggesting that the market is currently displaying characteristics of an impulsive wave. Impulsive waves are indicative of strong, directional movements in the market, signifying a potential trend in progress.
The main "Structure" under scrutiny is "blue wave 1," implying that the analysis centers on the initial wave within a larger Elliott Wave structure. This indicates an attempt to capture the early stages of what could be a significant market movement.
The designated "Position" is "Black wave 3," signifying the broader-degree wave within the Elliott Wave structure. This indicates that the analysis is conducted with a broader perspective, considering the potential third wave within a larger degree of trend.
The directional guidance for "Next Higher Degrees" is "Blue wave 1 (may have started)," suggesting an anticipation of the initiation of a potential larger-degree trend. This aligns with the impulsive mode, indicating a strong move in the upward direction.
Regarding "Details," the analysis notes that "red wave 5 blue wave C of 2 looking completed between fib level 61.80 to 78.60." This provides traders with a specific range of Fibonacci retracement levels within which the completion of the previous corrective wave is expected.
The "Wave Cancel invalid level" is set at 0.85548, serving as a crucial reference point for potential invalidation of the current wave count. This level acts as a guide for traders, indicating potential trend reversals or confirmations.
In conclusion, the USDCHF Elliott Wave Analysis on the daily chart suggests the potential commencement of an impulsive wave (blue wave 1) after the completion of a corrective phase. Traders are provided with insights into specific Fibonacci levels and a key reference point for potential trend reversals or confirmations in the broader trend.
Technical Analyst: Malik Awais
Source: Tradinglounge.com get trial here!