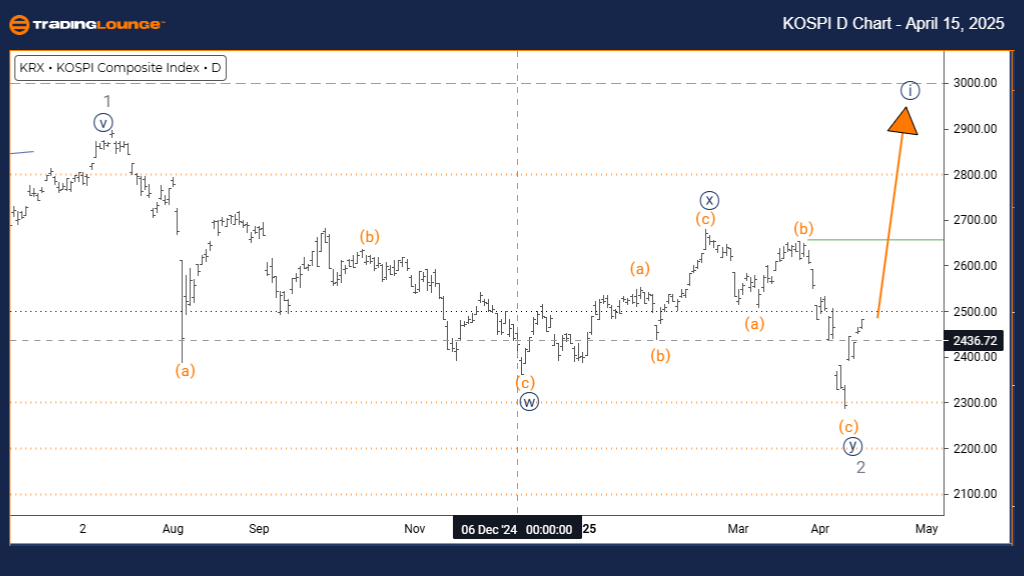
KOSPI Composite Elliott Wave Analysis – Trading Lounge Day Chart
KOSPI Composite Daily Timeframe Analysis
KOSPI Composite Wave Technical Analysis
FUNCTION: Trend
MODE: Impulsive
STRUCTURE: Navy blue wave 1
POSITION: Gray wave 3
DIRECTION NEXT HIGHER DEGREES: Navy blue wave 1 (initiated)
DETAILS: Gray wave 2 appears complete, and navy blue wave 1 of 3 is now developing.
The KOSPI Composite Index daily chart reveals the initiation of a new impulsive trend within the Elliott Wave framework. With the gray wave 2 correction completed, the market is now moving into navy blue wave 1, a sub-wave of the larger gray wave 3. This indicates the start of a bullish impulse wave, aligned with higher timeframe trends.
Navy blue wave 1 typically represents the first step of an advancing trend, often characterized by increasing momentum as investor confidence builds. Following the conclusion of gray wave 2, the current move suggests a measured but sustained price climb, laying the groundwork for more aggressive advances in subsequent waves.
Traders should anticipate navy blue wave 2 to follow upon the completion of wave 1. This corrective phase may present strategic buying opportunities before a robust wave 3 takes hold. From a daily Elliott Wave analysis perspective, the current price structure supports the beginning of a larger upward movement.
Monitoring key signals—such as rising trade volume and consistent price appreciation—will help validate the wave count. The advance into gray wave 3 signifies growing bullish strength, making wave 1's progress essential for early positioning. Price action and supporting indicators remain crucial for confirming this evolving wave formation.
This Elliott Wave outlook maintains a bullish bias, identifying this early impulse as a potential launchpad for longer-term gains. Keeping a close eye on the transition between waves 1 and 2 will be vital for traders aiming to capitalize on upcoming market moves.
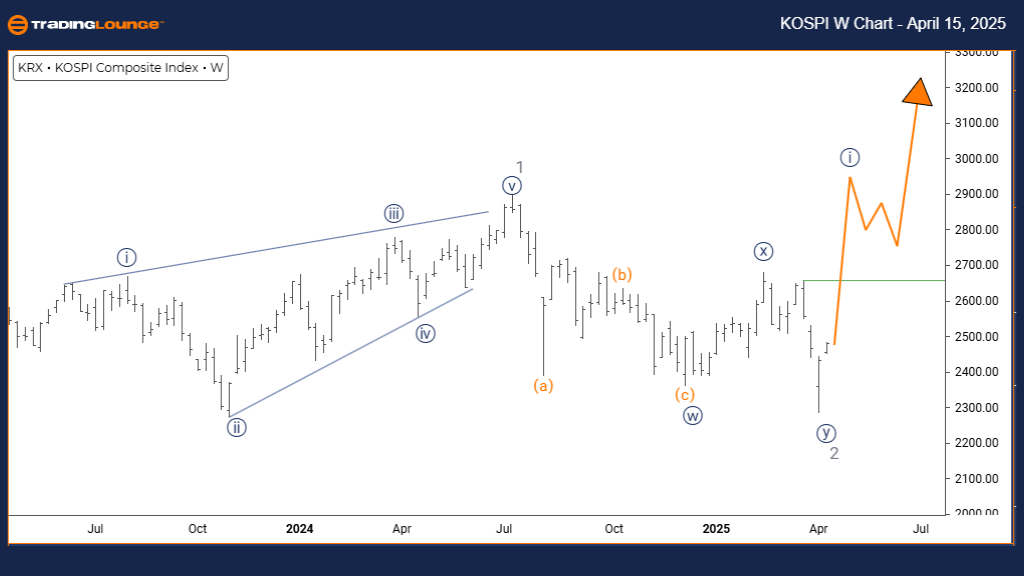
KOSPI Composite Elliott Wave Analysis – Trading Lounge Weekly Chart
KOSPI Composite Wave Technical Analysis – Weekly Timeframe
FUNCTION: Trend
MODE: Impulsive
STRUCTURE: Navy blue wave 1
POSITION: Gray wave 3
DIRECTION NEXT HIGHER DEGREES: Navy blue wave 1 (initiated)
DETAILS: Gray wave 2 appears complete; navy blue wave 1 of 3 is now progressing.
The KOSPI Composite weekly Elliott Wave analysis illustrates the early development of a bullish impulse wave within a larger uptrend. Following the completion of the gray wave 2 correction, the market is advancing through navy blue wave 1—the opening segment of the anticipated gray wave 3 sequence.
Navy blue wave 1 typically introduces sustained upward price action as the market shifts into a trending phase. With correction now behind, this stage may build momentum gradually, reinforcing the broader bullish structure. Weekly charts suggest a medium- to long-term rally may be unfolding.
This wave setup marks the beginning of what could become a strong gray wave 3, historically known for delivering powerful market moves in Elliott Wave theory. Traders should focus on indicators like rising volume and positive technical divergences to confirm that wave 1 is gaining traction.
Upon completing navy blue wave 1, a pullback in the form of wave 2 is expected, providing a potential re-entry zone for trend-following strategies. This weekly Elliott Wave forecast favors a positive outlook for the KOSPI Composite, indicating a maturing trend that could offer multiple trading opportunities.
As price action continues to unfold, validating each wave’s progression will be key. The wave count supports positioning in line with a strengthening trend, reinforcing the case for bullish strategies in the current Elliott Wave scenario.
Technical Analyst: Malik Awais
Source: Visit Tradinglounge.com and learn from the Experts. Join TradingLounge Here
Previous: NASDAQ Elliott Wave Technical Analysis
VALUE Offer - Buy 1 Month & Get 3 Months!Click here
Access 7 Analysts Over 200 Markets Covered. Chat Room With Support