28Apr

Nasdaq iShares (IBB) Elliott Wave Analysis Predicts Powerful Post-Triangle Breakout Rally Offering Prime Biotech ETF Buying Opportunity

Nasdaq iShares Biotechnology ETF (IBB) - Tradinglounge Weekly Chart

Nasdaq iShares Biotechnology IBB Weekly Chart Analysis

IBB ETF Elliott Wave Technical Analysis

Function: Major Trend

Mode: Motive

Structure: Triangle

Position: Wave [4]

Direction: Uptrend

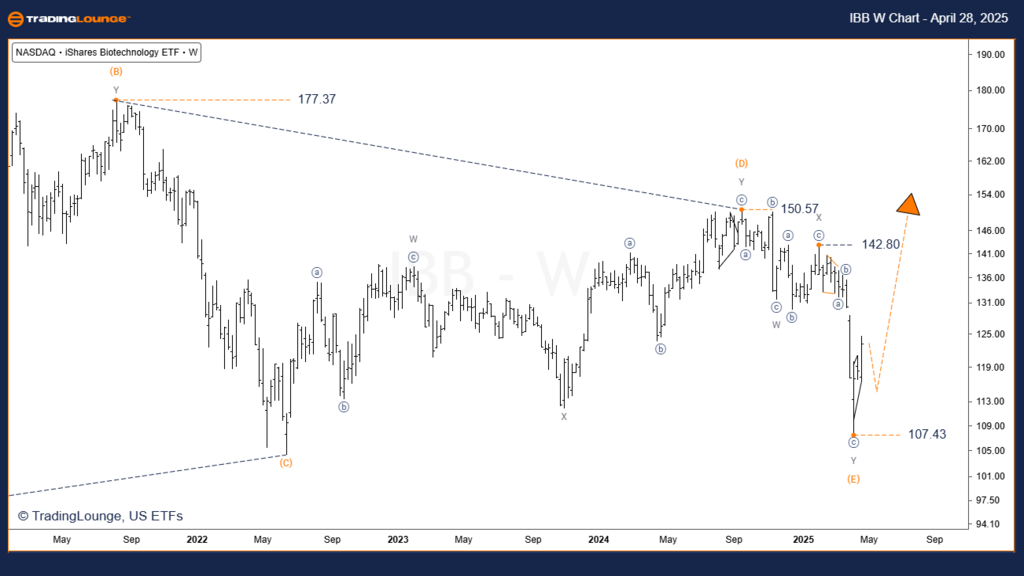
Details: The Elliott Wave analysis for the IBB Weekly Chart shows that wave [4] has completed its triangle pattern, signaling a major bullish opportunity for investors.

Following the triangle, a strong post-triangle thrust is unfolding, typically characterized by impulsive price action.
Currently, wave (1) of [5] is in progress, with an initial Elliott Wave target near $150 before a corrective wave (2) pullback occurs.
The confirmation level for this bullish forecast is set at $142.80.

Invalidation Level: $107.43

IBB-ETF-Weekly-chart...


Nasdaq iShares Biotechnology ETF (IBB) - Tradinglounge Daily Chart

Nasdaq iShares Biotechnology IBB Weekly Chart Analysis

IBB Elliott Wave Technical Analysis

Function: Major Trend

Mode: Motive

Structure: Impulse

Position: Wave [ii]

Direction: Minor Decline

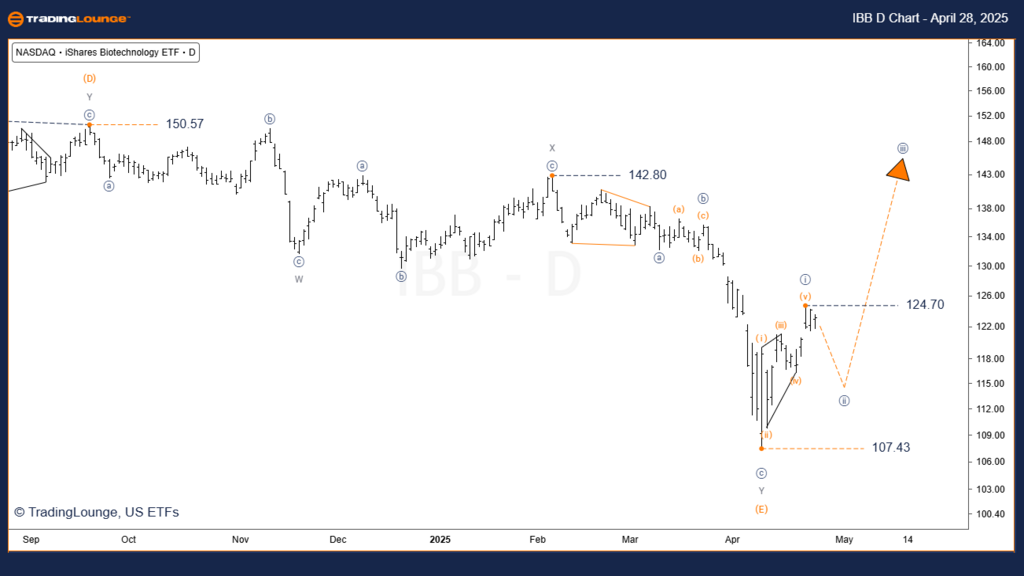
Details: The IBB Daily Chart Elliott Wave view suggests the current decline is part of a corrective wave [ii] within a broader bullish trend.

Wave [ii] may retrace a notable portion of the previous leading diagonal structure but should maintain the overall bullish Elliott Wave setup.

Upon completion, a strong impulsive move toward $142.80 is expected.

Invalidation Level: $107.43

Technical Analyst: Simon Brooks

Source: Visit Tradinglounge.com and learn from the Experts. Join TradingLounge Here 

See Previous: REMX Elliott Wave Technical Analysis

VALUE Offer - Buy 1 Month & Get 3 Months!Click here

Access 7 Analysts Over 200 Markets Covered. Chat Room With Support

IBB-ETF-daily-chart-...


Conclusion

  • The ongoing Elliott Wave rally in IBB appears to be in its early phase, with significant upside potential due to the post-triangle thrust pattern.
  • IBB is likely to retrace and exceed the full height of the previous triangle formation, offering a prime buying opportunity for ETF traders and investors.
  • Monitoring the Elliott Wave structure and adhering to the $107.43 invalidation level will be critical for effective risk management.

Related

Commodities & Futures Market Analysis: Elliott Wave Insights & Strategies

Commodities & Futures Market Analysis: Elliott Wave Insights & Strategies

The Commodities Market Trading Report provides a technical analysis using Elliott Wave, trading leve...

Read More >
TATA MOTORS Stocks Elliott Wave Technical Analysis - Stock Could be Approaching a Deeper Correction

TATA MOTORS Stocks Elliott Wave Technical Analysis - Stock Could be Approaching a Deeper Correction

This analysis of TATA Motors stock explores the current Elliott Wave counts and provides a detailed ...

Read More >
Understand the best Strategies for Navigating Bitcoin’s Price Action: Elliott Wave Analysis and BTCUSD Technical Trends

Understand the best Strategies for Navigating Bitcoin’s Price Action: Elliott Wave Analysis and BTCUSD Technical Trends

This article offers in-depth Bitcoin Elliott Wave analysis, focusing on BTCUSD technical trends, pri...

Read More >
Elliott Wave Trading Strategies: Top Market Analysis for SP500, NASDAQ & Tech Stocks

Elliott Wave Trading Strategies: Top Market Analysis for SP500, NASDAQ & Tech Stocks

Expert Elliott Wave analysis is provided for top markets including the SP500, NASDAQ 100, major tech...

Read More >
ASX: CAR Group Limited – Comprehensive Elliott Wave Analysis Reveals Bullish Trends and Key Price Targets for Traders

ASX: CAR Group Limited – Comprehensive Elliott Wave Analysis Reveals Bullish Trends and Key Price Targets for Traders

This article provides an in-depth Elliott Wave technical analysis of ASX: CAR Group Limited. It outl...

Read More >
Bitcoin/U.S. dollar(BTCUSD) Elliott Wave Technical Analysis 29 January 24

Bitcoin/U.S. dollar(BTCUSD) Elliott Wave Technical Analysis 29 January 24

Bitcoin and U.S. dollar(BTCUSD) Elliott Wave Technical Analysis dated 29 January 24, Day and 4-hour ...

Read More >

$1 for 2 Weeks

then $29 a month!

What a Special Offer!

Trade Recommendations

Unleash the power of deversified trading with our comprehensive portfolio, covering 250+ markets:

  • Stock Trades
  • Crypto Trades
  • Forex Trades
  • Commodity Trades
Elliott Wave Analysis

Gain a competitive edge with expert insights and AI-powered Elliott Wave charting into:

  • Global Indices
  • US Stocks & ASX Stocks
  • Forex & Crypto
  • Commodities
Top-Notch Trading Tools

Equip yourself with the tools of success:

  • Real-time Chat rooms
  • Elliott Wave Algorithm
  • Portfolio tools
  • TradingLevels
  • Screener
  • Trading Game
7 Elliott Wave Analysts

Stay ahead of the market with daily charts and insightful videos
Your secret to strategic trading!

JOIN HERE


Welcome to TradingLounge (ASIC A.R.No. 321187), specialists in trades, trading education and technical analysis, covering stocks, indices, commodities, forex and cryptocurrencies.

When you join TradingLounge you have access to everything we offer, including trade tools, educational content and a social platform to chat with like-minded investors.

Read more

@Copyright 2024 by tradinglounge.com

Contact Us

Australian no: 02 4787 6020

International no: +61 (2) 47876020

Pay with:

Find us on