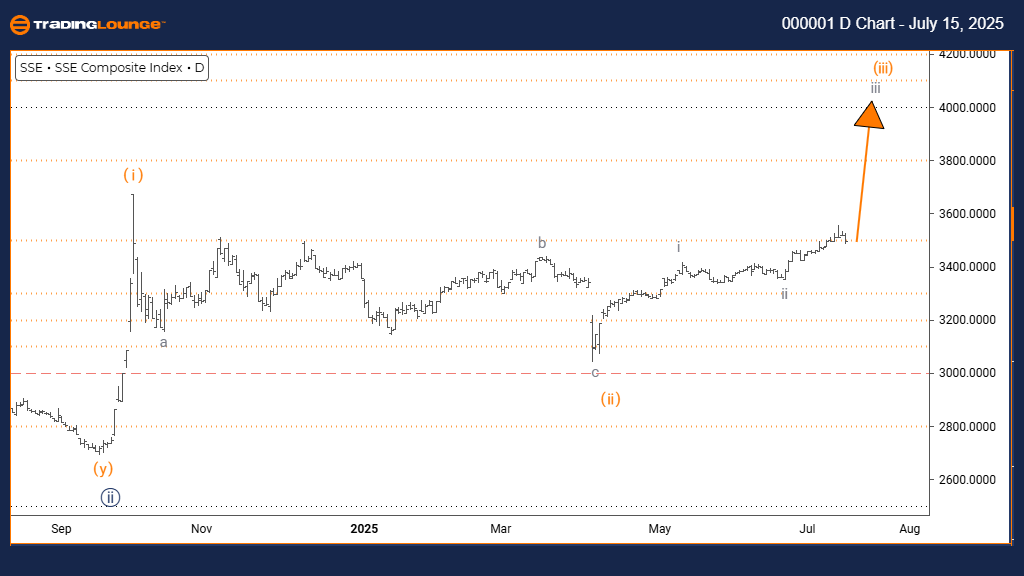
Shanghai Composite Elliott Wave Analysis – Trading Lounge Day Chart
Shanghai Composite Elliott Wave Technical Analysis
Function: Bullish Market Direction
Mode: Impulsive Wave Movement
Structure: Developing Gray Wave 3
Position: Advancing Orange Wave 3
Direction Next Higher Degrees: Active Gray Wave 3
Details: Completion of Gray Wave 2 confirmed; Gray Wave 3 in progress.
The daily Elliott Wave analysis of the Shanghai Composite Index reveals a sustained bullish market trend. Price behavior is impulsive, signaling the development of Gray Wave 3 within the ongoing Orange Wave 3. This progression suggests a powerful upward price movement is underway.
Chart analysis verifies the end of corrective Gray Wave 2, transitioning now into a dynamic Gray Wave 3, often known as the most forceful Elliott Wave. Historically, this wave sees increased buyer interest and volume spikes, supporting sustained gains.
As Orange Wave 3 advances, the Shanghai Composite shows signs of initiating a robust bullish phase. Technical momentum is aligned with this view, and traders may find high-probability long trade opportunities in the current setup.
Market participants should track this phase for signs of continued acceleration, as third waves in Elliott patterns often extend price action significantly. The daily chart structure indicates more room for gains before any substantial pullback materializes.
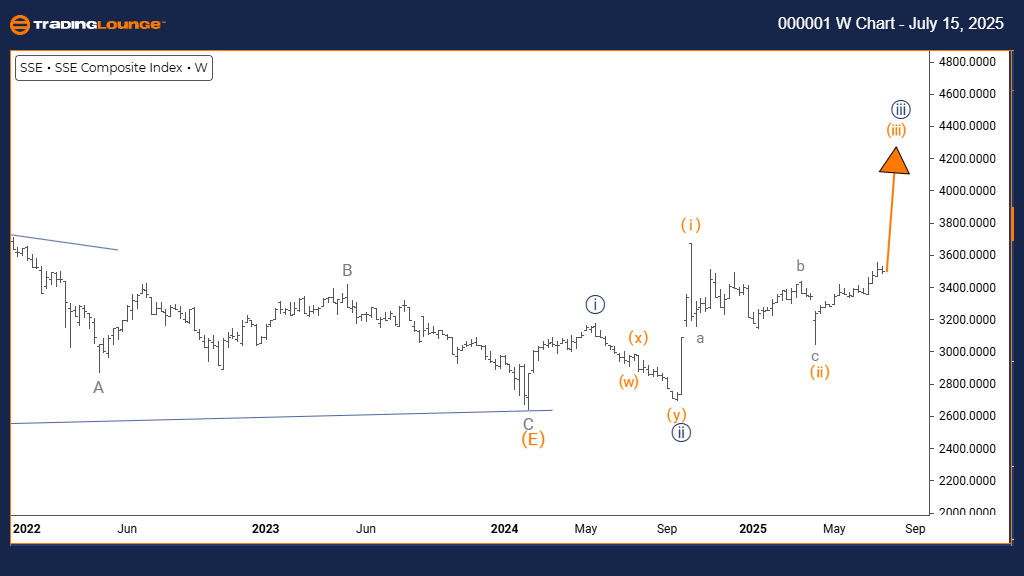
Shanghai Composite Elliott Wave Analysis – Trading Lounge Weekly Chart
Shanghai Composite Elliott Wave Technical Analysis
Function: Sustained Bullish Trend
Mode: Impulsive Rally
Structure: Orange Wave 3 Forming
Position: Advancing Navy Blue Wave 3
Direction Next Lower Degrees: Upcoming Orange Wave 4
Details: Orange Wave 2 completed; Orange Wave 3 of 3 underway.
The weekly Elliott Wave perspective on the Shanghai Composite underscores a firm bullish trend continuation. The index now progresses through Orange Wave 3 within Navy Blue Wave 3, typically a high-momentum segment in wave theory.
Analysis confirms that Orange Wave 2 has concluded, ushering in Orange Wave 3, known for its aggressive ascent and strong institutional buying patterns. This wave phase commonly drives sharp and extended price movements.
As this upward move unfolds, Orange Wave 4 is expected next—a moderate correction phase. Until that development, bullish sentiment remains dominant in the broader trend cycle.
Traders can leverage this setup as Wave 3 of 3 configurations often offer ideal conditions for trend-based strategies. The current Elliott Wave count and structure suggest continued upward momentum, reinforced across both short and long-term timeframes.
Technical Analyst: Malik Awais
Source: Visit Tradinglounge.com and learn from the Experts. Join TradingLounge Here
Previous: DOW JONES index Elliott Wave Technical Analysis
VALUE Offer - Buy 1 Month & Get 3 Months!Click here
Access 7 Analysts Over 200 Markets Covered. Chat Room With Support