15Jul

Dow Jones Elliott (DJI) Wave Analysis Reveals Bullish Wave 1 Structure with Market Trend Insights and Forecast for Stock Traders

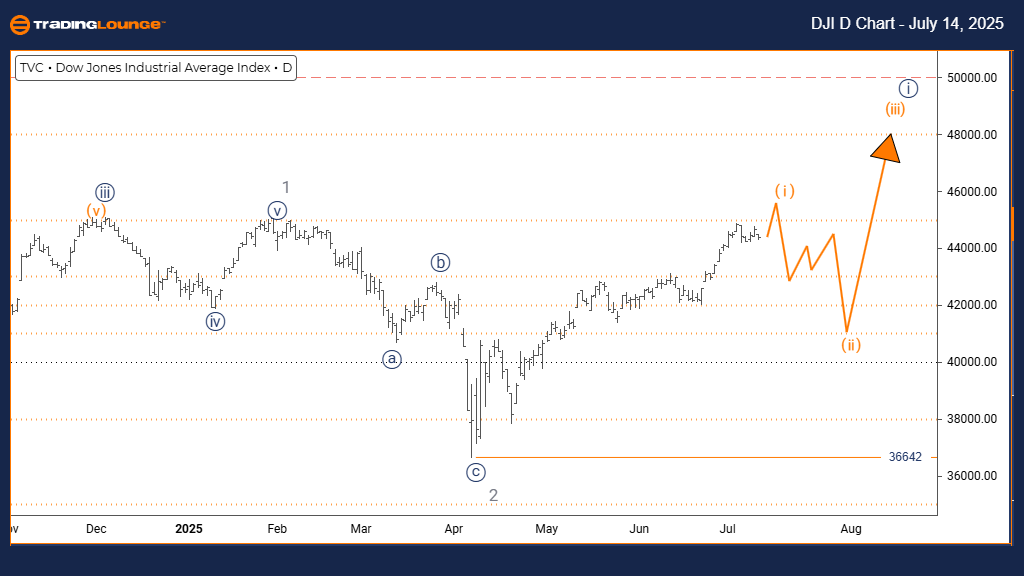
DOW JONES Elliott Wave Analysis – Trading Lounge Day Chart

DJI Elliott Wave Technical Analysis 

Function: Bullish Trend

Mode: Impulsive

Structure: Orange Wave 1

Position: Navy Blue Wave 1

Direction (Next Lower Degrees): Orange Wave 2

Details: Gray wave 2 seems complete; orange wave 1 of navy blue wave 1 is active.

Invalidation Level: 36642

The Dow Jones Industrial Average daily chart indicates the start of a new bullish Elliott Wave cycle. The market is progressing through orange wave 1, nested within the larger navy blue wave 1, signaling a possible continuation of upward momentum after the end of gray wave 2.

This impulsive wave formation reflects strong buying pressure and a consistent pattern of higher highs and higher lows. The anticipated corrective phase, orange wave 2, is likely to follow, offering traders a technical opportunity to enter the trend after orange wave 1 confirms completion.

The key technical level of 36642 acts as an invalidation point. A drop below this level would negate the current wave count and warrant a reassessment. Until then, this setup offers a valid framework for trend-following strategies and may mark the early stages of a prolonged bullish run.

DJI-d-index-chart-14...


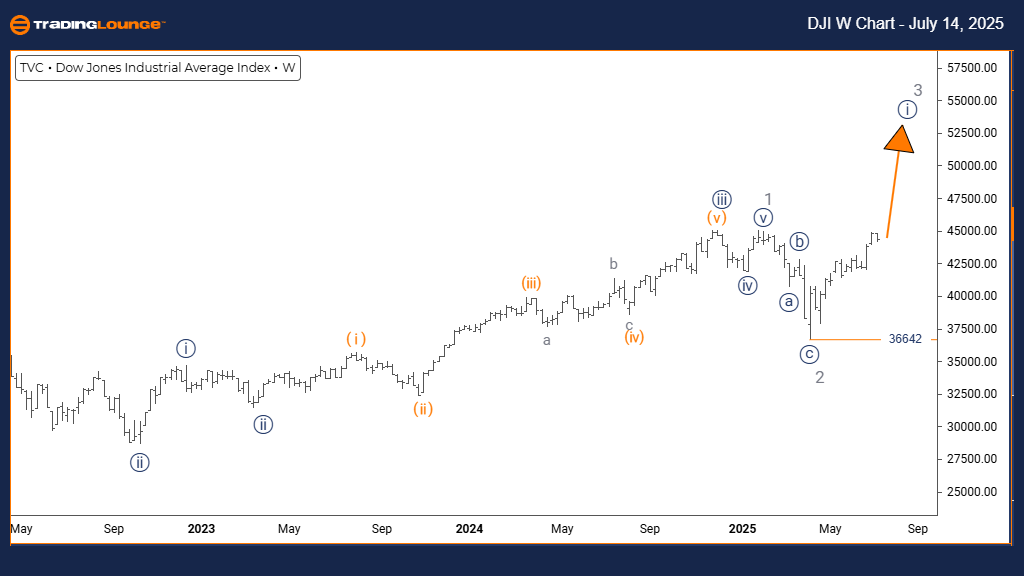
DOW JONES Elliott Wave Analysis – Trading Lounge Weekly Chart

DJI Elliott Wave Technical Analysis 

Function: Bullish Trend

Mode: Impulsive

Structure: Navy Blue Wave 1

Position: Gray Wave 3

Direction (Next Lower Degrees): Navy Blue Wave 2

Details: Gray wave 2 appears finished; navy blue wave 1 of gray wave 3 is unfolding.

Invalidation Level: 36642

The weekly Dow Jones chart highlights a bullish Elliott Wave pattern, with the index transitioning into navy blue wave 1 of a more significant gray wave 3. This phase often delivers the strongest market movement within Elliott Wave theory.

The impulsive structure reveals strong bullish momentum, underpinned by aggressive buying and elongated wave formations. Following the completion of navy blue wave 1, a pullback forming navy blue wave 2 is expected. This retracement could provide an advantageous entry into the broader trend.

The 36642 support level serves as the invalidation line. As long as prices remain above this level, the bullish interpretation stays intact. The chart setup implies a likely continuation of the long-term uptrend, with substantial upside potential in line with the nature of wave 3 extensions.

This analysis can guide Elliott Wave traders in aligning their strategies with the dominant upward trend, while remaining cautious of short-term corrections that might create low-risk trading opportunities.

Technical Analyst: Malik Awais

Source: Visit Tradinglounge.com and learn from the Experts. Join TradingLounge Here

Previous: S&P/TSX 60 index Elliott Wave Technical Analysis

VALUE Offer - Buy 1 Month & Get 3 Months!Click here

Access 7 Analysts Over 200 Markets Covered. Chat Room With Support

DJI-w-index-chart-14...

Related

 Microsoft Inc. (MSFT) Elliott Wave Technical Analysis: Explore Key Support Levels and Market Insights for Stock Investors

Microsoft Inc. (MSFT) Elliott Wave Technical Analysis: Explore Key Support Levels and Market Insights for Stock Investors

This Elliott Wave analysis for Microsoft Inc. (MSFT) evaluates the stock's daily and 1-hour char...

Read More >
Comprehensive AUD/USD Elliott Wave Analysis: Daily & 4-Hour Charts Reveal Key Trends and Technical Levels for Forex Traders

Comprehensive AUD/USD Elliott Wave Analysis: Daily & 4-Hour Charts Reveal Key Trends and Technical Levels for Forex Traders

This analysis provides an in-depth look at the AUD/USD currency pair through the lens of Elliott Wav...

Read More >
VanEck Gold Miners ETF (GDX) Elliott Wave Analysis: Bullish Trend, Resistance & Support Levels, and Investment Opportunities

VanEck Gold Miners ETF (GDX) Elliott Wave Analysis: Bullish Trend, Resistance & Support Levels, and Investment Opportunities

GDX Elliott Wave Analysis indicates a strong bullish trend, with a potential rally to new all-time h...

Read More >
Bovespa Index Elliott Wave Technical Analysis Reveals Bullish Trend with Active Impulsive Wave 3 in Brazil's Stock Market

Bovespa Index Elliott Wave Technical Analysis Reveals Bullish Trend with Active Impulsive Wave 3 in Brazil's Stock Market

The Bovespa Index is exhibiting a strong bullish trend, currently progressing through Orange Wave 3 ...

Read More >
S&P/TSX 60 Elliott Wave Analysis: Daily and Weekly TSX Index Forecast with Wave 2 Correction and Wave 3 Breakout Insight

S&P/TSX 60 Elliott Wave Analysis: Daily and Weekly TSX Index Forecast with Wave 2 Correction and Wave 3 Breakout Insight

Elliott Wave analysis of the S&P/TSX 60 index on both daily and weekly timeframes. It highlights the...

Read More >
Grasim Industries Stocks Elliott Wave Technical Analysis: Insights & Price Targets with Daily and 4H Chart Breakdowns

Grasim Industries Stocks Elliott Wave Technical Analysis: Insights & Price Targets with Daily and 4H Chart Breakdowns

Grasim Industries' Elliott Wave analysis reveals key technical patterns and stock predictions. E...

Read More >

$1 for 2 Weeks

then $29 a month!

What a Special Offer!

Trade Recommendations

Unleash the power of deversified trading with our comprehensive portfolio, covering 250+ markets:

  • Stock Trades
  • Crypto Trades
  • Forex Trades
  • Commodity Trades
Elliott Wave Analysis

Gain a competitive edge with expert insights and AI-powered Elliott Wave charting into:

  • Global Indices
  • US Stocks & ASX Stocks
  • Forex & Crypto
  • Commodities
Top-Notch Trading Tools

Equip yourself with the tools of success:

  • Real-time Chat rooms
  • Elliott Wave Algorithm
  • Portfolio tools
  • TradingLevels
  • Screener
  • Trading Game
7 Elliott Wave Analysts

Stay ahead of the market with daily charts and insightful videos
Your secret to strategic trading!

JOIN HERE


Welcome to TradingLounge (ASIC A.R.No. 321187), specialists in trades, trading education and technical analysis, covering stocks, indices, commodities, forex and cryptocurrencies.

When you join TradingLounge you have access to everything we offer, including trade tools, educational content and a social platform to chat with like-minded investors.

Read more

@Copyright 2024 by tradinglounge.com

Contact Us

Australian no: 02 4787 6020

International no: +61 (2) 47876020

Pay with:

Find us on