Gold XAUUSD Commodity Elliott Wave Technical Analysis

Function: Trend

Mode: Corrective

Structure: Likely Zigzag

Position: Wave C of (4)

Direction: Wave C of (4) is still in play

Details: Gold fell sharply on Friday, marking the end of Wave B and the start of Wave C, which could extend lower before Wave 5 begins its upward movement.

Gold Elliott Wave Analysis

Gold experienced a sharp decline last week, influenced by reports from China and strong US job numbers. The recovery seen in early June has been completely eroded, suggesting the commodity may head lower in the short term. However, despite this downturn, Gold remains in a bullish trend. The fall from the May 20th high of 2450 is still considered corrective, indicating that the bullish trend should resume.

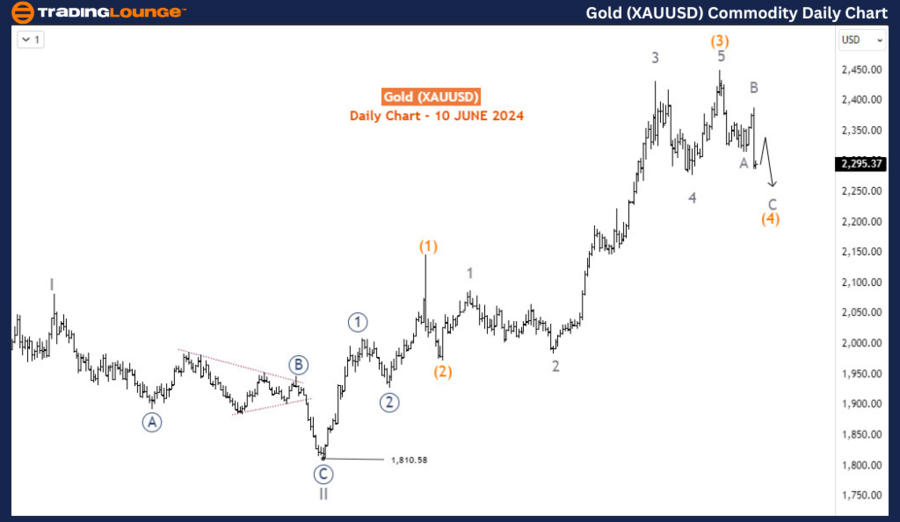
Daily Chart Analysis:

The daily chart shows that the intermediate wave (3) concluded at 2450 with an expanding diagonal structure. Since reaching this high, Gold has been in a corrective phase. Typically, the fourth wave (wave (4)) corrects up to 38.2% of the third wave (wave (3)) and can sometimes approach the 50% retracement level. It usually does not surpass this level; otherwise, it could signify a different wave structure. In this scenario, Gold could decline in wave (4) to 2269, which represents the 38.2% retracement of wave (3), or even further to 2213, corresponding to the 50% retracement level.
Gold-XAUUSD-Day-comm...


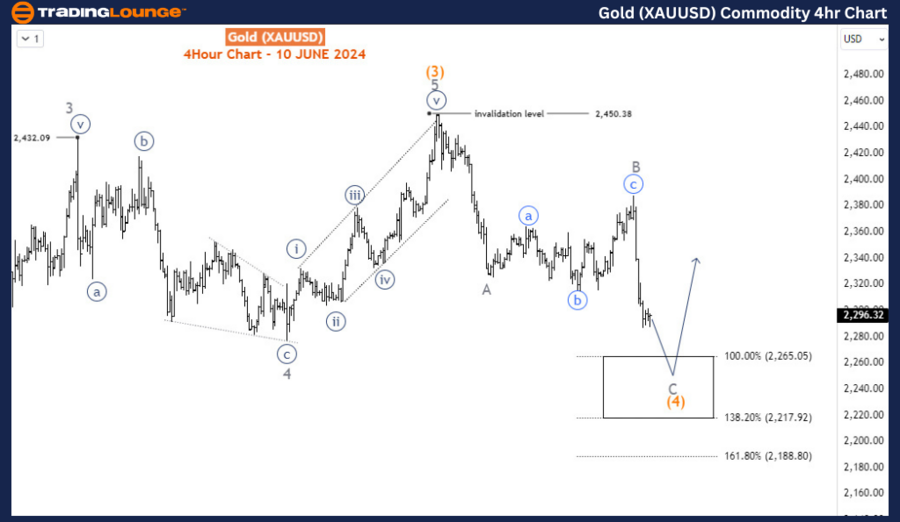
H4 Chart Analysis:

On the H4 chart, it appears that wave (4) is forming a zigzag structure. This includes:

  • An impulse wave for wave A
  • An expanding flat for wave B
  • Another impulse likely to complete wave C

In a zigzag pattern, wave C often extends to 100-138.2% of the Fibonacci projection of wave A from B. These levels are at 2265-2217, aligning closely with the 2269-2213 retracement projections mentioned earlier for wave (4). We anticipate wave (4) will end around these levels, setting the stage for wave (5) to begin as buyers push the price toward a fresh high in the ongoing bullish trend.

Technical Analyst: Sanmi Adeagbo

Source: visit Tradinglounge.com and learn From the Experts Join TradingLounge Here 

See Previous: Uranium ETF (URA) Elliott Wave Technical Analysis

Special Trial Offer - 0.76 Cents a Day for 3 Months! Click here

Access 7 Analysts Over 170 Markets Covered. Chat Room With Support
Gold-XAUUSD-4Hr-comm...

Summary:

Gold's sharp decline last week, influenced by external economic reports, suggests a potential for further short-term weakness. Nonetheless, the overall bullish trend remains intact. The daily chart indicates that Gold is in the corrective wave (4), which could see prices drop to the 2269-2213 range, corresponding to the 38.2% and 50% retracement levels of wave (3). The H4 chart supports this view, identifying a zigzag structure in wave (4) that could complete between 2265-2217. Once wave (4) concludes, wave (5) is expected to begin, propelling Gold toward new highs. Traders should monitor the 2269-2213 range for signs of the correction ending and the resumption of the bullish trend.

Related

Commodity Corn: Elliott Wave analysis of Corn Prices Reveals Ongoing Bearish Trends and Potential Trading Opportunities

Commodity Corn: Elliott Wave analysis of Corn Prices Reveals Ongoing Bearish Trends and Potential Trading Opportunities

Our detailed Elliott Wave analysis of Corn prices reveals ongoing bearish trends and potential tradi...

Read More >
S&P 500 Elliott Wave Analysis Reveals SPX Impulse Patterns, and Trading Strategies for Market Volatility Insights

S&P 500 Elliott Wave Analysis Reveals SPX Impulse Patterns, and Trading Strategies for Market Volatility Insights

S&P 500 Elliott Wave analysis from both daily and weekly perspectives. It highlights the current wav...

Read More >
Nestle India Stock Analysis with Elliott Wave Technical Patterns, Corrective Waves, Resistance Levels, and Chart Insights

Nestle India Stock Analysis with Elliott Wave Technical Patterns, Corrective Waves, Resistance Levels, and Chart Insights

This comprehensive analysis of Nestle India stock dives into Elliott Wave patterns, including correc...

Read More >
NASDAQ Elliott Wave Forecast Shows Bullish Impulse Structure with Strong Trading Opportunity Based on Market Signals

NASDAQ Elliott Wave Forecast Shows Bullish Impulse Structure with Strong Trading Opportunity Based on Market Signals

The NASDAQ is showing a bullish Elliott Wave pattern with an impulsive wave structure suggesting str...

Read More >
Understand PYPL’s Market Direction and Anticipated Price Movements: PayPal Holdings Inc. Stocks Elliott Wave Technical Analysis

Understand PYPL’s Market Direction and Anticipated Price Movements: PayPal Holdings Inc. Stocks Elliott Wave Technical Analysis

This analysis of PayPal Holdings Inc. (PYPL) offers a detailed look at both daily and 1-hour chart p...

Read More >
Commodity Market Elliott Wave Analysis: Bitcoin, Ethereum, Gold, Silver, Crude Oil, and More

Commodity Market Elliott Wave Analysis: Bitcoin, Ethereum, Gold, Silver, Crude Oil, and More

Get the latest Commodity Market Elliott Wave Analysis for Bitcoin, Ethereum, GBTC, TLT Bonds, US 10 ...

Read More >

$1 for 2 Weeks

then $29 a month!

What a Special Offer!

Trade Recommendations

Unleash the power of deversified trading with our comprehensive portfolio, covering 250+ markets:

  • Stock Trades
  • Crypto Trades
  • Forex Trades
  • Commodity Trades
Elliott Wave Analysis

Gain a competitive edge with expert insights and AI-powered Elliott Wave charting into:

  • Global Indices
  • US Stocks & ASX Stocks
  • Forex & Crypto
  • Commodities
Top-Notch Trading Tools

Equip yourself with the tools of success:

  • Real-time Chat rooms
  • Elliott Wave Algorithm
  • Portfolio tools
  • TradingLevels
  • Screener
  • Trading Game
7 Elliott Wave Analysts

Stay ahead of the market with daily charts and insightful videos
Your secret to strategic trading!

JOIN HERE


Welcome to TradingLounge (ASIC A.R.No. 321187), specialists in trades, trading education and technical analysis, covering stocks, indices, commodities, forex and cryptocurrencies.

When you join TradingLounge you have access to everything we offer, including trade tools, educational content and a social platform to chat with like-minded investors.

Read more

@Copyright 2024 by tradinglounge.com

Contact Us

Australian no: 02 4787 6020

International no: +61 (2) 47876020

Pay with:

Find us on