GBPJPY Elliott Wave Analysis Trading Lounge Day Chart
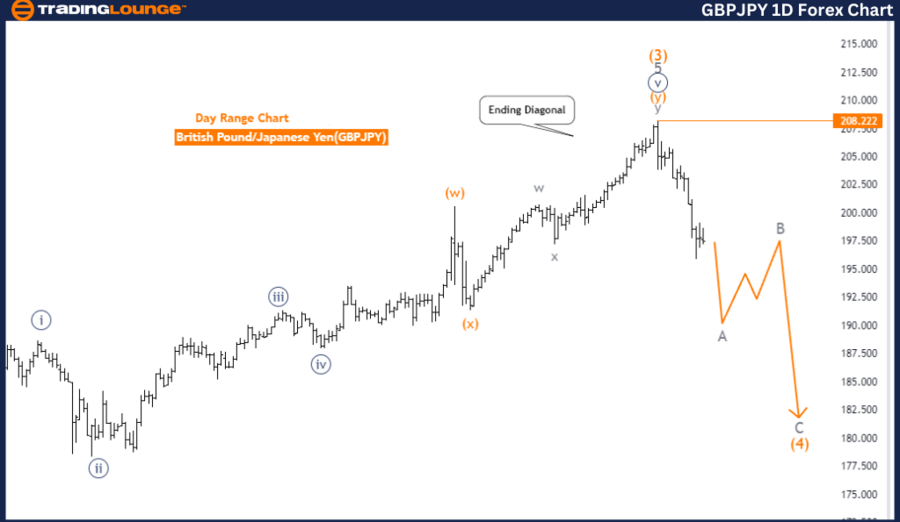
British Pound/Japanese Yen (GBPJPY) Day Chart Analysis
GBPJPY Elliott Wave Technical Analysis
Function: Counter Trend
Mode: Corrective
Structure: Gray Wave A
Position: Orange Wave 4
Next Higher Degree Direction: Gray Wave B
Details: Gray Wave A is still developing and nearing completion. Wave Cancel Invalid Level: 208.222
The GBPJPY Elliott Wave analysis on the daily chart shows a counter-trend movement, categorized as corrective. The current focus is on Gray Wave A, which is positioned within Orange Wave 4. This indicates that the market is in a corrective phase within the broader wave structure.
The analysis indicates that Gray Wave A is still in progress and appears to be nearing its end. This conclusion would mark the end of the current corrective phase and the beginning of Gray Wave B. Gray Wave B is expected to move in the opposite direction, indicating a potential shift in market sentiment.
The next movement at a higher degree is identified as Gray Wave B. After Gray Wave A concludes, the market is anticipated to transition into Gray Wave B, possibly resulting in a significant corrective move that could retrace some of the progress made by the previous wave.
A critical point in this analysis is the wave cancel invalid level, set at 208.222. This level is essential for confirming the current wave structure. If the market price exceeds this level, it would invalidate the current wave analysis, necessitating a reevaluation of the wave count.
In summary, the GBPJPY daily chart analysis suggests that the market is in a counter-trend phase within Gray Wave A, situated in Orange Wave 4. The analysis forecasts the end of Gray Wave A and a transition to Gray Wave B. The wave cancellation invalid level of 208.222 is a crucial threshold for validating this wave analysis.
GBPJPY Elliott Wave Analysis Trading Lounge 4-Hour Chart
British Pound/Japanese Yen (GBPJPY) 4 Hour Chart Analysis
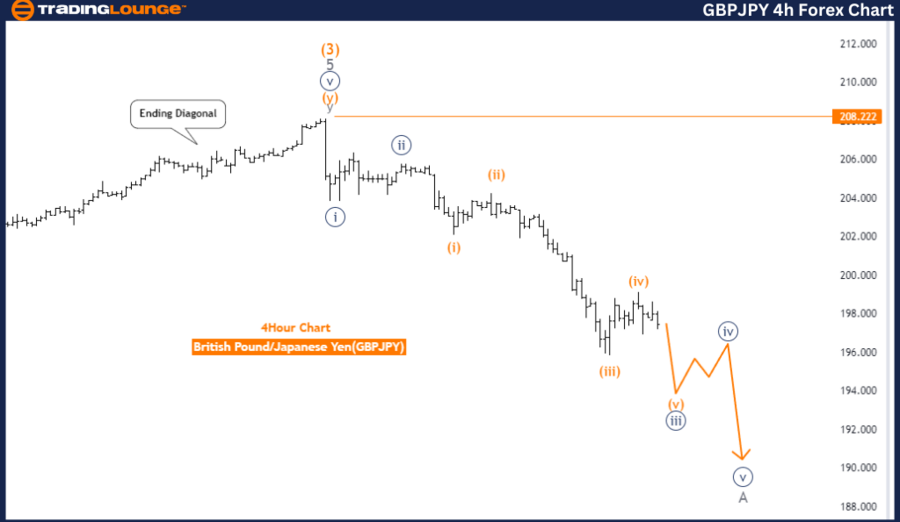
GBPJPY Elliott Wave Technical Analysis
Function: Counter Trend
Mode: Impulsive
Structure: Navy Blue Wave 3
Position: Gray Wave A
Next Higher Degree Direction: Navy Blue Wave 4
Details: Navy Blue Wave 2 of A appears complete, with Navy Blue Wave 3 currently in progress. Wave Cancel Invalid Level: 208.222
The GBPJPY Elliott Wave analysis on the 4-hour chart identifies a counter-trend movement, described as impulsive. The specific wave structure being analyzed is Navy Blue Wave 3, currently within Gray Wave A. This indicates the market is experiencing the third wave of a corrective phase.
The analysis shows that Navy Blue Wave 2 of A has completed. This completion marks the end of a corrective phase and the beginning of an impulsive phase, represented by Navy Blue Wave 3. This wave is expected to demonstrate a strong directional movement as it develops.
The next higher degree movement is identified as Navy Blue Wave 4. After the completion of the current impulsive phase (Navy Blue Wave 3), the market is anticipated to enter another corrective phase, represented by Navy Blue Wave 4. This phase typically signifies a retracement or consolidation after an impulsive move.
A crucial detail in this analysis is the wave cancel invalid level, set at 208.222. This level serves as a validation point for the current wave structure. If the market price surpasses this level, it would invalidate the current wave analysis, indicating that the expected wave pattern is no longer valid and requiring a reevaluation of the wave count.
In summary, the GBPJPY 4-hour chart analysis indicates the market is in a counter-trend phase within Navy Blue Wave 3, situated in Gray Wave A. The completion of Navy Blue Wave 2 suggests the market has entered an impulsive phase, with Navy Blue Wave 3 currently unfolding. Following this, the market is expected to transition into a corrective phase, characterized by Navy Blue Wave 4. The wave cancel invalid level of 208.222 is a critical threshold for validating this wave analysis.
Technical Analyst: Malik Awais
Source: visit Tradinglounge.com and learn From the Experts Join TradingLounge Here
Previous: AUDUSD Elliott Wave Technical Analysis
Special Trial Offer - 0.76 Cents a Day for 3 Months! Click here
Access 7 Analysts Over 170 Markets Covered. Chat Room With Suppor