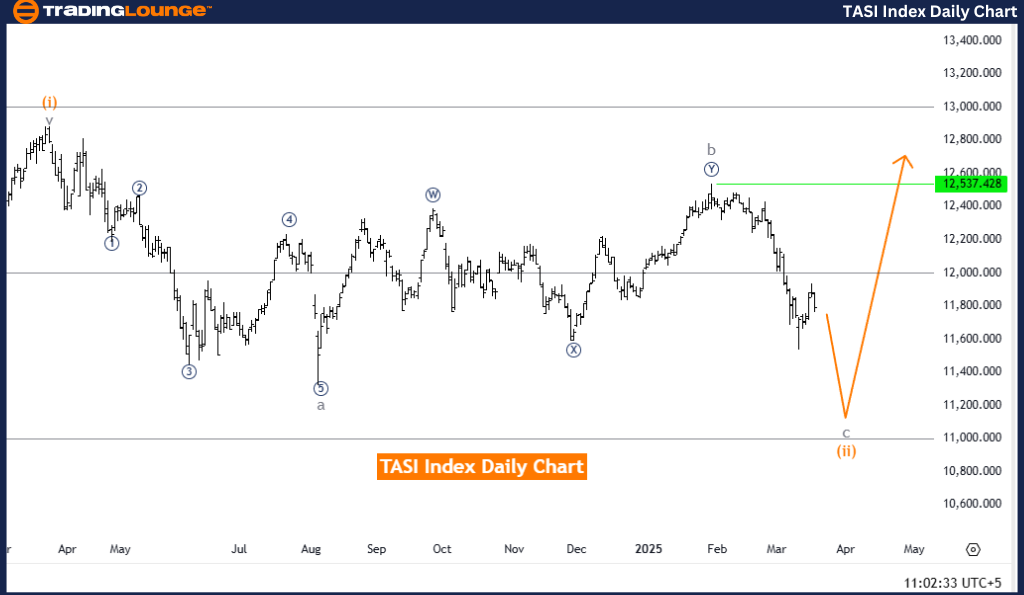
TASI Index Elliott Wave Analysis – Trading Lounge Daily Chart
TASI Index Wave Technical Analysis
Function: Counter Trend
Mode: Impulsive
Structure: Gray Wave C
Position: Orange Wave 2
Direction Next Higher Degree: Orange Wave 3
Analysis Overview
The TASI Index Elliott Wave Analysis on the daily chart offers a comprehensive insight into the index's trend and potential future movements.
- The market is currently experiencing a counter-trend phase, led by impulsive price movements instead of corrective action.
- The primary wave structure in focus is Gray Wave C, forming part of the larger pattern within Orange Wave 2.
- Gray Wave B appears to have concluded, signaling a transition into Gray Wave C.
- This wave is expected to be strong and directional, likely continuing until the next major market shift.
- The next higher-degree wave to observe is Orange Wave 3, which may emerge once Gray Wave C is completed.
Key Trading Considerations
- Track the progress of Gray Wave C as it moves toward completion.
- Prepare for the potential emergence of Orange Wave 3, which could indicate a change in market direction.
- Traders should closely examine wave structures to forecast price movements accurately.
Trading Insights
This daily chart analysis provides a structured approach for traders to understand TASI Index trends and price action.
- Identifying wave completions and trend formations helps anticipate potential market shifts.
- Wave patterns and price movements play a critical role in strategic trading decisions.
- A long-term approach enables traders to align their strategies with significant market developments.
Conclusion
This Elliott Wave Analysis of the TASI Index presents a clear framework for analyzing price action and forecasting future market trends. By focusing on wave structures, key price levels, and trend transitions, traders can approach the market with greater confidence and precision.
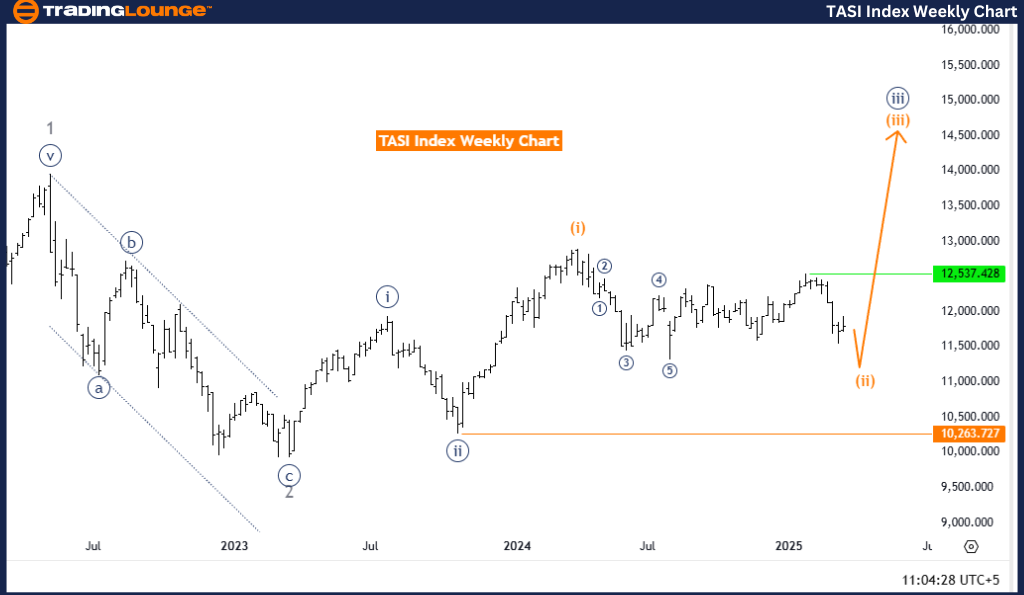
TASI Index Elliott Wave Analysis – Trading Lounge Weekly Chart
TASI Index Wave Technical Analysis
Function: Counter Trend
Mode: Corrective
Structure: Orange Wave 2
Position: Navy Blue Wave 3
Direction Next Higher Degree: Orange Wave 3
Wave Cancel Invalidation Level: 10,263.727
Analysis Overview
The TASI Index Elliott Wave Analysis on the weekly chart provides an in-depth examination of current market trends and future price movements.
- The market is currently in a counter-trend phase, characterized by corrective price movements rather than a strong directional trend.
- The primary wave under review is Orange Wave 2, part of a larger corrective structure within Navy Blue Wave 3.
- Orange Wave 1 has likely concluded, transitioning the market into Orange Wave 2.
- Orange Wave 2 is expected to be corrective, potentially moving sideways or retracing before the next significant trend emerges.
- The next higher-degree wave to observe is Orange Wave 3, expected to develop after Orange Wave 2 is completed.
Key Levels & Trading Considerations
- Invalidation Level: 10,263.727
If the price surpasses this level, the current wave count becomes invalid, possibly signaling a shift in market direction.
- Traders should monitor Orange Wave 2's progress and prepare for the potential formation of Orange Wave 3.
Trading Insights
This weekly chart analysis provides traders with a broader market outlook, essential for understanding the TASI Index’s long-term structure.
- Recognizing wave patterns and key price levels is critical for informed trading decisions.
- Identifying wave completions and emerging trends helps traders anticipate market changes.
- A wider perspective enables traders to align their strategies with major market trends and turning points.
Conclusion
This Elliott Wave Analysis of the TASI Index delivers a structured approach to interpreting price action and forecasting market trends. By closely monitoring wave structures, key levels, and trend transitions, traders can navigate market conditions with greater clarity and confidence.
Technical Analyst: Malik Awais
Source: Visit Tradinglounge.com and learn from the Experts. Join TradingLounge Here
Previous: Hang Seng Elliott Wave Technical Analysis
VALUE Offer - Buy 1 Month & Get 3 Months!Click here
Access 7 Analysts Over 200 Markets Covered. Chat Room With Support