AAPL Elliott Wave Analysis Trading Lounge Daily Chart, 28 February 24

Welcome to our AAPL Elliott Wave Analysis Trading Lounge, your premier destination for comprehensive insights into Apple Inc. (AAPL) using Elliott Wave Technical Analysis. As of the Daily Chart on 28th February 2024, we explore significant trends shaping the market.

AAPL Elliott Wave Technical Analysis

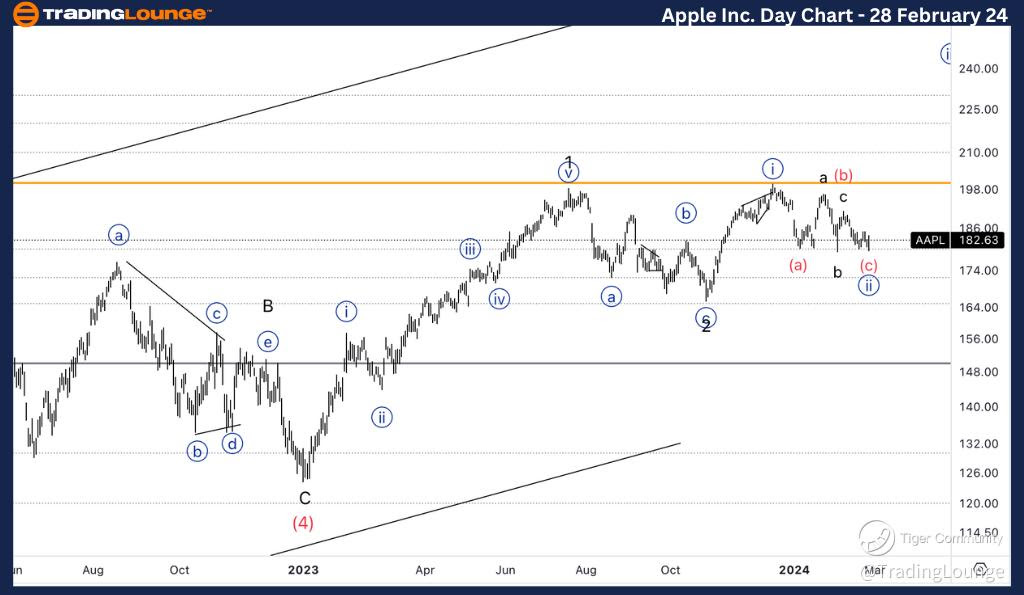
Apple Inc., (AAPL) Daily Chart Analysis

FUNCTION: Counter Trend

MODE: Corrective

STRUCTURE: Flat

POSITION: Wave (c) of {ii}.  

DIRECTION: Bottoming in wave {ii}.  

DETAILS: Despite the fact we keep finding resistance on top of TL2 at 200$, the bullish count is still valid as, on the other hand, we keep finding support on top of the end of MG2 at 180$. We are looking for a end of wave (c) to then find additional confirmation higher. The safe trades stands after finding support on 200$.

In terms of wave dynamics, we identify a counter-trend function with a corrective structure, specifically a flat pattern. The current position is in Wave (c) of {ii}, indicating potential bottoming in Wave {ii}. Despite encountering resistance at TL2 at $200, the bullish count remains valid as we consistently find support at the end of MG2 at $180. We anticipate the completion of wave (c) for additional confirmation higher, with a safe trade identified after finding support at $200.
Apple-Inc-Day-Stock-...


AAPL Elliott Wave Analysis Trading Lounge, 28 February 24

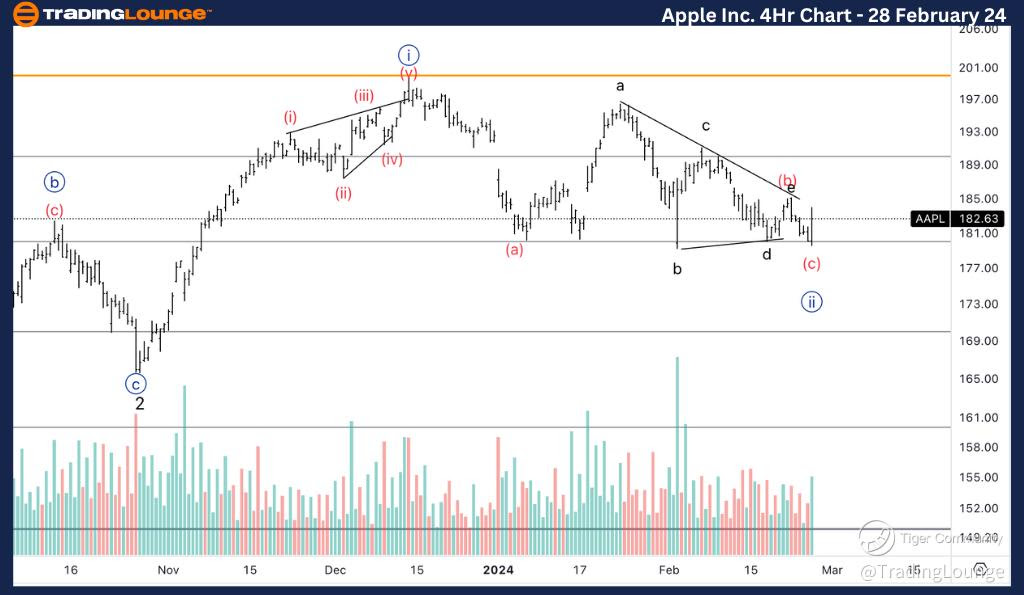
Apple Inc., (AAPL) 4Hr Chart Analysis

AAPL Elliott Wave Technical Analysis

FUNCTION: Counter Trend

MODE: Corrective

STRUCTURE: Flat

POSITION: Wave (c) of {ii}.

DIRECTION: Bottoming in wave {ii}.  

DETAILS: Here we take a look at an alternative count, with a triangle in wave (b) instead of a regular flat correction. Looking for either a short wave (c) in place, or else we are in substitute wave ii of (c).

Here, we explore an alternative count with a triangle pattern in wave (b) instead of a regular flat correction. The present position is in Wave (c) of {ii}, also suggesting bottoming in wave {ii}. We anticipate either a short wave (c) in place or substitute wave ii of (c) to unfold.

Technical Analyst: Alessio Barretta

Source: visit Tradinglounge.com and learn From the Experts Join TradingLounge Here 

See Previous: Alphabet Inc.,(GOOGL)

TradingLounge Once Off SPECIAL DEAL: Here > 1 month Get 3 months.   
Apple-Inc-4H-Stock-c...

Related

VeChain Elliott Wave Analysis Signals Possible Wave III Breakout from Support: VETUSD Trading Strategy for Crypto Traders

VeChain Elliott Wave Analysis Signals Possible Wave III Breakout from Support: VETUSD Trading Strategy for Crypto Traders

The VETUSD pair is nearing the end of Wave II in a corrective structure. A bounce from the 0.020–0....

Read More >
Market Update: Preparing for the Next Trade Setup

Market Update: Preparing for the Next Trade Setup

Most stocks are approaching the final stages of their Impulse, currently in Wave iv) within Wave 1. ...

Read More >
Soybeans Elliott Wave Technical Analysis: Assessing Current Impulse and Future Trends

Soybeans Elliott Wave Technical Analysis: Assessing Current Impulse and Future Trends

This article provides an in-depth Elliott Wave analysis of the soybean market. It covers the ongoing...

Read More >
IBEX 35 Technical Analysis Using Elliott Wave Shows Bullish Momentum, Investment Outlook, and Trading Strategy Insights

IBEX 35 Technical Analysis Using Elliott Wave Shows Bullish Momentum, Investment Outlook, and Trading Strategy Insights

Elliott Wave analysis of the IBEX 35 index, highlighting its current bullish trend. Learn about wave...

Read More >
Mahindra & Mahindra Stock Analysis: Elliott Wave Forecast Reveals Bullish Trend, Critical Support Levels, and Upcoming Price Movements

Mahindra & Mahindra Stock Analysis: Elliott Wave Forecast Reveals Bullish Trend, Critical Support Levels, and Upcoming Price Movements

Mahindra & Mahindra stock analysis uses Elliott Wave patterns to forecast bullish trends, key suppor...

Read More >
Euro/U.S.Dollar(EURUSD) Day Chart Elliott Wave Technical Analysis 10 November 23

Euro/U.S.Dollar(EURUSD) Day Chart Elliott Wave Technical Analysis 10 November 23

Euro/U.S.Dollar(EURUSD) Day Chart Elliott Wave Technical Analysis 10 November 23 suggests a Counter ...

Read More >

$1 for 2 Weeks

then $29 a month!

What a Special Offer!

Trade Recommendations

Unleash the power of deversified trading with our comprehensive portfolio, covering 250+ markets:

  • Stock Trades
  • Crypto Trades
  • Forex Trades
  • Commodity Trades
Elliott Wave Analysis

Gain a competitive edge with expert insights and AI-powered Elliott Wave charting into:

  • Global Indices
  • US Stocks & ASX Stocks
  • Forex & Crypto
  • Commodities
Top-Notch Trading Tools

Equip yourself with the tools of success:

  • Real-time Chat rooms
  • Elliott Wave Algorithm
  • Portfolio tools
  • TradingLevels
  • Screener
  • Trading Game
7 Elliott Wave Analysts

Stay ahead of the market with daily charts and insightful videos
Your secret to strategic trading!

JOIN HERE


Welcome to TradingLounge (ASIC A.R.No. 321187), specialists in trades, trading education and technical analysis, covering stocks, indices, commodities, forex and cryptocurrencies.

When you join TradingLounge you have access to everything we offer, including trade tools, educational content and a social platform to chat with like-minded investors.

Read more

@Copyright 2024 by tradinglounge.com

Contact Us

Australian no: 02 4787 6020

International no: +61 (2) 47876020

Pay with:

Find us on