27Sep

Cocoa Elliott Wave Technical Analysis: Key Market Trends and Strategies for Navigating the Cocoa Commodity Market.

Ranjeet | 27 Sep, 2024 | Commodities | 0 Comments | Return|

Cocoa Commodity Elliott Wave Technical Analysis

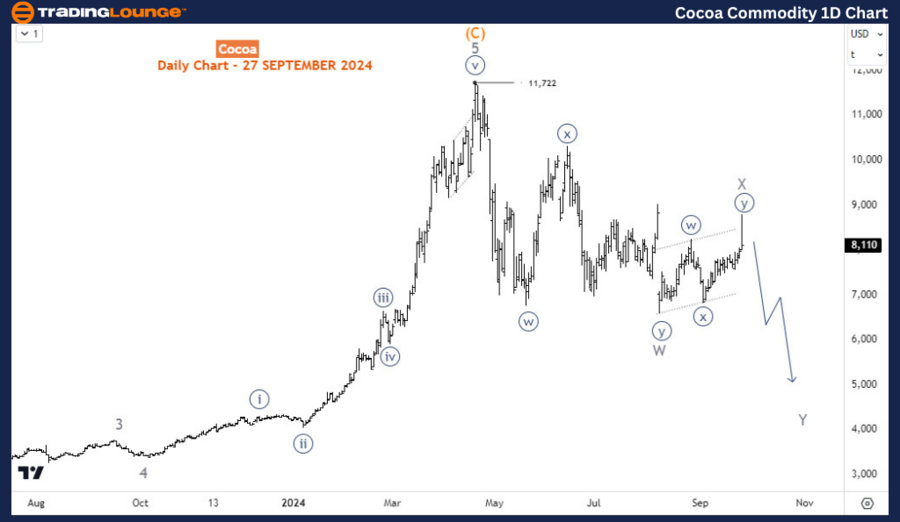
After reaching an all-time high of 11,722 in April 2024, Cocoa prices have entered a corrective phase, remaining in a consolidation period. Since May 2024, Cocoa has traded primarily below the 10,000 mark, indicating that the ongoing bearish correction could extend further. The current corrective cycle is expected to continue below the August 2024 low, potentially dropping toward the 5,000 level or lower before resuming the long-term bullish trend.

Cocoa Commodity Daily Chart Analysis

On the daily chart, a double zigzag corrective pattern is emerging from the April high. The first leg of the correction, wave W, ended on August 8th, with the current upward movement representing wave X. Once wave X completes, wave Y is anticipated to follow, which could push prices down toward the 5,000 level or even lower. Unless Cocoa prices see a significant rebound near the 11,000 level, the downside scenario remains the most likely, suggesting the correction is not yet complete.

Cocoa-Commodity-1D-C...


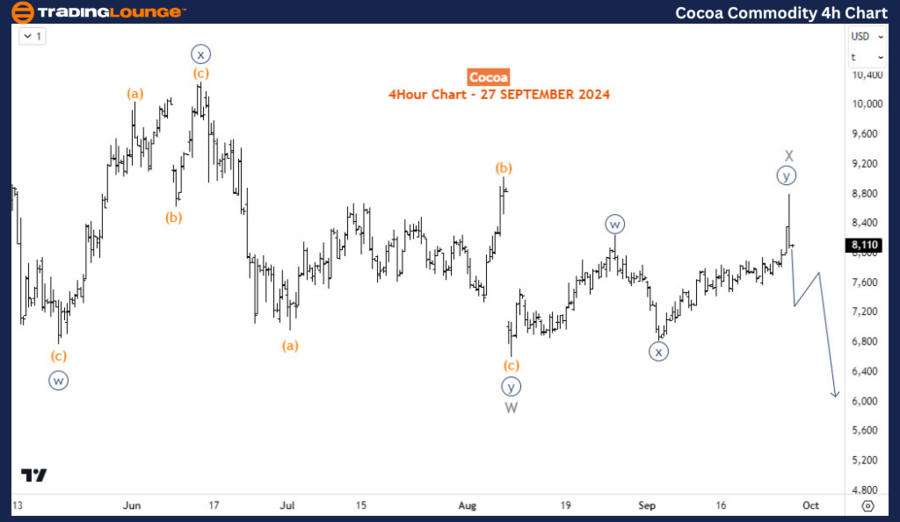
Cocoa Commodity H4 Chart Analysis

In the H4 chart, wave X appears to have completed its own double zigzag pattern. As prices approach the wave x (circled) low at 6,850, the probability of wave Y commencing increases. A break below this level would likely confirm the start of wave Y, followed by a breach of the 6,600 level, where wave W previously ended.

Technical Analyst: Sanmi Adeagbo

Source: visit Tradinglounge.com and learn From the Experts Join TradingLounge Here 

See Previous: Silver (XAGUSD) Elliott Wave Technical Analysis

VALUE Offer - Buy 1 Month & Get 3 Months!Click here

Access 7 Analysts Over 200 Markets Covered. Chat Room With Support

Cocoa-Commodity-4H-C...


Conclusion

Cocoa's corrective phase seems far from over, with the potential for further declines toward 5,000 or below. The market remains in a larger bearish cycle that started after the April 2024 peak. While a strong rebound could alter the outlook, the price action indicates the corrective structure will likely continue. A break below 6,850 would be a key signal confirming the start of wave Y, accelerating the move toward completing this corrective phase.

Related

The Walt Disney Company (DIS) Stock - Elliottwave Technical Analysis

The Walt Disney Company (DIS) Stock - Elliottwave Technical Analysis

This comprehensive analysis provides an expert overview of The Walt Disney Company (DIS) stock, util...

Read More >
Theta Token (THETAUSD) Elliott Wave Analysis: Bullish Reversal Setup and Key Trading Zones

Theta Token (THETAUSD) Elliott Wave Analysis: Bullish Reversal Setup and Key Trading Zones

THETAUSD using Elliott Wave theory. It outlines the current corrective wave structure, key support a...

Read More >
XRP/ U.S. dollar(XRPUSD) Elliott Wave Technical Analysis 29 November 23

XRP/ U.S. dollar(XRPUSD) Elliott Wave Technical Analysis 29 November 23

XRP/ U.S. dollar(XRPUSD) Elliott Wave Technical Analysis dated 29 November 23

Read More >
Euro/ U.S. Dollar (EURUSD) Elliott Wave Forecast Shows Bullish Trend Nearing Completion with Key Trading Insights

Euro/ U.S. Dollar (EURUSD) Elliott Wave Forecast Shows Bullish Trend Nearing Completion with Key Trading Insights

EURUSD Elliott Wave analysis highlights a bullish trend approaching completion on daily and 4-hour c...

Read More >
Expert Forex Market Forecasts on Euro/ U.S. Dollar pair using detailed EURUSD Elliott Wave Technical Analysis

Expert Forex Market Forecasts on Euro/ U.S. Dollar pair using detailed EURUSD Elliott Wave Technical Analysis

Our detailed analysis of the EURUSD pair using Elliott Wave theory provides insights into the curren...

Read More >

$1 for 2 Weeks

then $29 a month!

What a Special Offer!

Trade Recommendations

Unleash the power of deversified trading with our comprehensive portfolio, covering 250+ markets:

  • Stock Trades
  • Crypto Trades
  • Forex Trades
  • Commodity Trades
Elliott Wave Analysis

Gain a competitive edge with expert insights and AI-powered Elliott Wave charting into:

  • Global Indices
  • US Stocks & ASX Stocks
  • Forex & Crypto
  • Commodities
Top-Notch Trading Tools

Equip yourself with the tools of success:

  • Real-time Chat rooms
  • Elliott Wave Algorithm
  • Portfolio tools
  • TradingLevels
  • Screener
  • Trading Game
7 Elliott Wave Analysts

Stay ahead of the market with daily charts and insightful videos
Your secret to strategic trading!

JOIN HERE


Welcome to TradingLounge (ASIC A.R.No. 321187), specialists in trades, trading education and technical analysis, covering stocks, indices, commodities, forex and cryptocurrencies.

When you join TradingLounge you have access to everything we offer, including trade tools, educational content and a social platform to chat with like-minded investors.

Read more

@Copyright 2024 by tradinglounge.com

Contact Us

Australian no: 02 4787 6020

International no: +61 (2) 47876020

Pay with:

Find us on