DIS Elliott Wave Analysis Trading Lounge Daily Chart

Welcome to our DIS Elliott Wave Analysis Trading Lounge, where we dive into The Walt Disney Company (DIS) using Elliott Wave Technical Analysis. Let's uncover the market dynamics on the Daily Chart.

The Walt Disney Company, (DIS) Daily Chart Analysis

DIS Elliott Wave Technical Analysis

FUNCTION: Trend

MODE: Impulsive

STRUCTURE: Motive  

POSITION: Wave (1).

DIRECTION: Upside in wave 5 of (1).

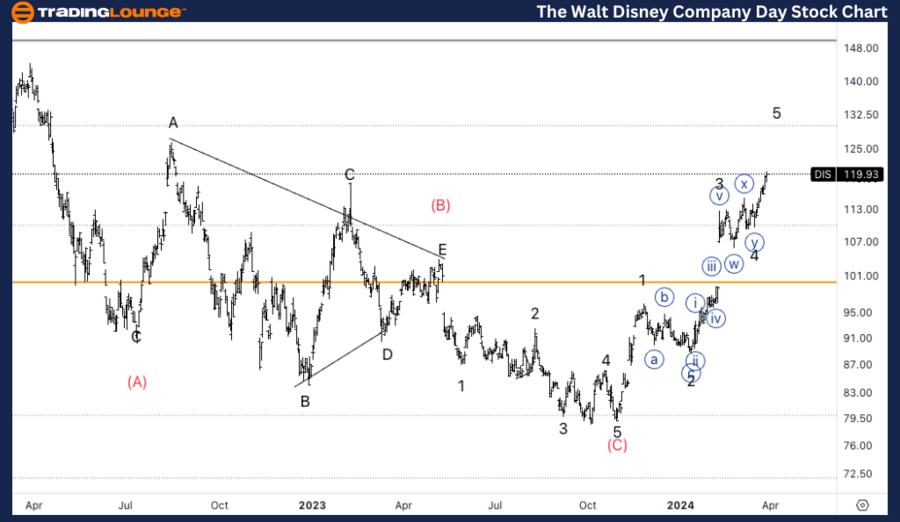
DETAILS: After a major bear market that lasted 3 years we have seen support on top of TL1 at 100$. As we are continuing higher we could be facing support at the end of MG1 at 130$.

Elliott Wave Analysis of DIS: Unraveling Market Trends

Our analysis indicates a trending function characterized by impulsive mode and motive structure, positioned in Wave (1). The direction signals an upside momentum in wave 5 of (1). Following a significant bear market spanning three years, we've observed support atop TL1 at $100. As we continue to ascend, potential support may emerge around the conclusion of MG1 at $130.
DIS-Day-Stock-Chart-...


DIS Elliott Wave Analysis Trading Lounge 4H Chart

The Walt Disney Company, (DIS) 4H Chart Analysis

Elliott Wave Technical Analysis of DIS Stock

FUNCTION: Trend

MODE: Impulsive

STRUCTURE: Motive  

POSITION: Wave {iii} of 5.  

DIRECTION: Upside in wave {iii}.

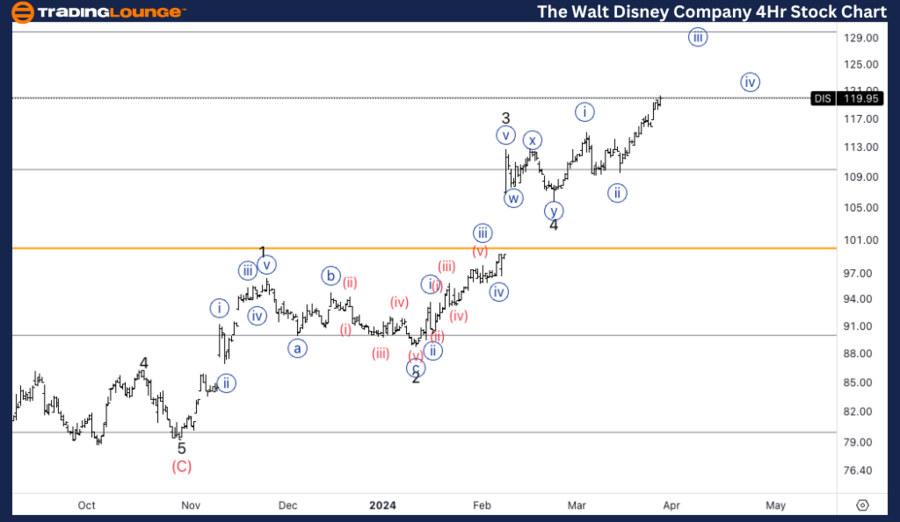
DETAILS: Here we are displaying a bit of a different count with a smaller wave 4 and a clear {i}-{ii} within wave 5.

DIS Elliott Wave Analysis: A Closer Look on the 4-Hour Chart

Here, we also identify a trending function marked by impulsive mode and motive structure, positioned in Wave {iii} of 5. The direction indicates an upside trajectory in wave {iii}. Our count reveals a nuanced perspective, depicting a smaller wave 4 and a clear {i}-{ii} delineation within wave 5.

Technical Analyst: Alessio Barretta

Source: visit Tradinglounge.com and learn From the Experts Join TradingLounge Here 

See Previous: Johnson & Johnson (JNJ) 

TradingLounge Once Off SPECIAL DEAL: Here > 1 month Get 3 months.
DIS-4hr-Stock-Chart-...

Related

GBPUSD Elliott Wave Forecast: Daily and 4-Hour Chart Analysis with Key Trading Levels, and Strategy Insights

GBPUSD Elliott Wave Forecast: Daily and 4-Hour Chart Analysis with Key Trading Levels, and Strategy Insights

Detailed GBPUSD Elliott Wave analysis for daily and 4-hour charts, showing corrective wave structure...

Read More >
Unlock ASX Trading Potential: REA GROUP LTD Stock Analysis & REA Elliott Wave Technical Forecast

Unlock ASX Trading Potential: REA GROUP LTD Stock Analysis & REA Elliott Wave Technical Forecast

Get the latest Elliott Wave analysis for ASX REA Group. Discover key stock trends, wave counts, and ...

Read More >
Gold (XAUUSD) Commodity Elliott Wave Technical Analysis: Examining the latest trends and price movements

Gold (XAUUSD) Commodity Elliott Wave Technical Analysis: Examining the latest trends and price movements

This article provides an in-depth Elliott Wave analysis of the gold market, examining the latest tre...

Read More >
Elliott Wave Forecast for BLOCK, INC - XYZ (SQ2): Technical Analysis Reveals Potential Rally and Trading Opportunities

Elliott Wave Forecast for BLOCK, INC - XYZ (SQ2): Technical Analysis Reveals Potential Rally and Trading Opportunities

ASX BLOCK INC (XYZ SQ2) using Elliott Wave Theory to predict stock movements, identify trend reversa...

Read More >
British Pound/U.S. Dollar (GBPUSD) Elliott Wave Analysis: Bullish Trend Unfolds with Orange Wave 3 Developing – Forex Trading Strategy

British Pound/U.S. Dollar (GBPUSD) Elliott Wave Analysis: Bullish Trend Unfolds with Orange Wave 3 Developing – Forex Trading Strategy

GBPUSD Elliott Wave analysis highlights a bullish trend, with Orange Wave 3 developing and signaling...

Read More >
Grasim Industries Stocks Elliott Wave Technical Analysis: Insights & Price Targets with Daily and 4H Chart Breakdowns

Grasim Industries Stocks Elliott Wave Technical Analysis: Insights & Price Targets with Daily and 4H Chart Breakdowns

Grasim Industries' Elliott Wave analysis reveals key technical patterns and stock predictions. E...

Read More >

$1 for 2 Weeks

then $29 a month!

What a Special Offer!

Trade Recommendations

Unleash the power of deversified trading with our comprehensive portfolio, covering 250+ markets:

  • Stock Trades
  • Crypto Trades
  • Forex Trades
  • Commodity Trades
Elliott Wave Analysis

Gain a competitive edge with expert insights and AI-powered Elliott Wave charting into:

  • Global Indices
  • US Stocks & ASX Stocks
  • Forex & Crypto
  • Commodities
Top-Notch Trading Tools

Equip yourself with the tools of success:

  • Real-time Chat rooms
  • Elliott Wave Algorithm
  • Portfolio tools
  • TradingLevels
  • Screener
  • Trading Game
7 Elliott Wave Analysts

Stay ahead of the market with daily charts and insightful videos
Your secret to strategic trading!

JOIN HERE


Welcome to TradingLounge (ASIC A.R.No. 321187), specialists in trades, trading education and technical analysis, covering stocks, indices, commodities, forex and cryptocurrencies.

When you join TradingLounge you have access to everything we offer, including trade tools, educational content and a social platform to chat with like-minded investors.

Read more

@Copyright 2024 by tradinglounge.com

Contact Us

Australian no: 02 4787 6020

International no: +61 (2) 47876020

Pay with:

Find us on