Amazon.com Inc., Elliott Wave Analysis TradingLounge Daily Chart Insights
Amazon.com Inc. (AMZN) presents an intriguing setup on its daily chart, showcasing the power of Elliott Wave Analysis in understanding market trends and potential future movements. Here’s a deep dive into the technical landscape of AMZN based on the Elliott Wave principle:
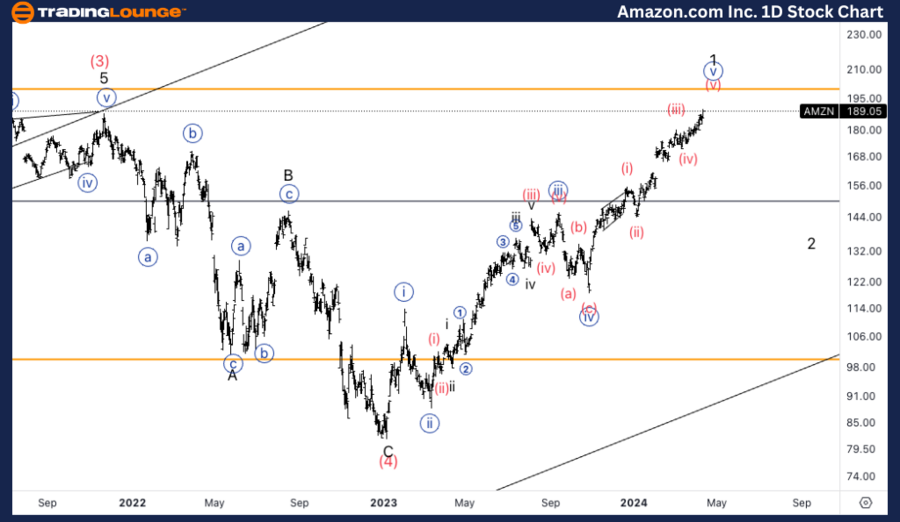
AMZN Daily Chart Analysis
AMZN Elliott Wave Technical Analysis
- Function: The primary function observed is Trend, indicating a significant movement in a particular direction.
- Mode: The current mode is Impulsive, suggesting strong momentum and a clear trend direction.
- Structure: The structure is categorized as Motive, typical of waves that propel the market further in the direction of the predominant trend.
- Position: We are currently tracking Minor Wave 1, an initial wave that sets the stage for further development.
- Direction: The anticipated direction is upwards, specifically in wave {v} of 1, pointing towards a bullish outlook.
- Details: The analysis forecasts an upward trajectory aiming for Trading Level 2 at $200. This comes after AMZN hit the previous all-time high (ATH) in the latest trading session, indicating strong bullish momentum.
Amazon.com Inc., Elliott Wave Analysis 4-Hour Chart Insights
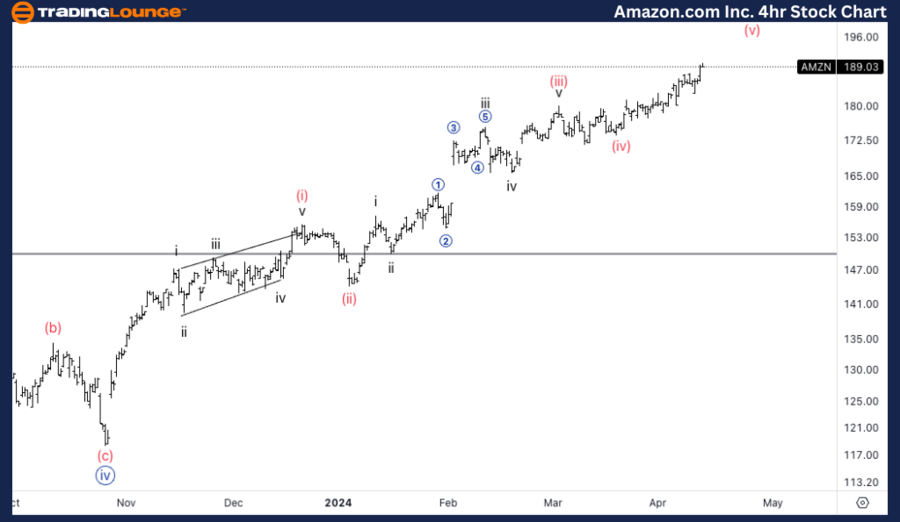
AMZN 4-Hour Chart Insights
Elliott Wave Analysis of AMZN Stock
Shifting the focus to the 4-hour chart of Amazon.com Inc. (AMZN), we uncover more details about the ongoing trends and potential future movements:
- Function: Similar to the daily chart, the function remains Trend, underlining the significance of the current movement direction.
- Mode: The mode is Impulsive, indicating a continuation of strong momentum.
- Structure: The Motive structure is observed here as well, highlighting the waves that contribute to the trend's propulsion.
- Position: The specific position under scrutiny is Wave {v}, crucial for understanding the immediate market dynamics.
- Direction: The direction is upwards, in wave (v) of {v}, suggesting a bullish continuation.
- Details: The 4-hour chart anticipates an upward move into wave (v), with two primary scenarios unfolding. The first scenario envisages an extension with a series of ones and twos, targeting higher levels around $200. Alternatively, a movement upwards in a series of threes could form an ending diagonal, offering a different path to the bullish outcome.
Elliott Wave Analysis Scenarios and Implications for Investors
AMZN's Elliott Wave Analysis on both daily and 4-hour charts points towards a bullish trend with a target of $200, reinforced by the recent achievement of a new ATH. Investors and traders should watch for these critical developments:
Technical Analyst: Alessio Barretta
Source: visit Tradinglounge.com and learn From the Experts Join TradingLounge Here
See Previous: McDonald's Corp. (MCD)
TradingLounge Once Off SPECIAL DEAL: Here > 1 month Get 3 months.
TradingLounge's Free Week Extravaganza!
April 14 – 21: Unlock the Doors to Trading Excellence — Absolutely FREE
Conclusion and Trading Strategy
The technical analysis of Amazon.com Inc. (AMZN) through Elliott Wave Theory reveals a strong bullish outlook with a potential target of $200. Investors and traders should closely monitor the unfolding patterns and adjust their strategies accordingly, keeping an eye on the extension and ending diagonal scenarios.