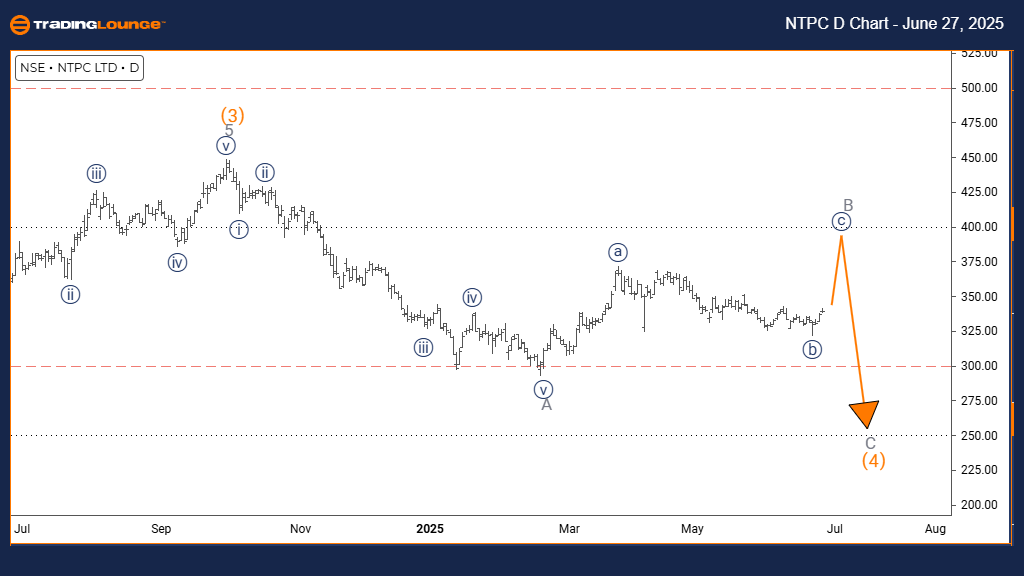
NTPC Elliott Wave Analysis | Trading Lounge Day Chart
NTPC Elliott Wave Technical Analysis
FUNCTION: Counter Trend
MODE: Impulsive
STRUCTURE: Navy Blue Wave C
POSITION: Gray Wave B
DIRECTION NEXT LOWER DEGREES: Gray Wave C
DETAILS: Navy Blue Wave B has likely completed; Navy Blue Wave C is progressing.
The daily Elliott Wave analysis for NTPC stock reveals a counter-trend phase within the price movement. The current mode is impulsive, suggesting a strong move against the larger market direction. This activity forms Navy Blue Wave C, situated within the broader corrective pattern labeled Gray Wave B. This positioning implies the counter-trend movement is advancing toward its end.
The analysis indicates Navy Blue Wave B has likely concluded, making way for Navy Blue Wave C, which typically finishes off the corrective trend. This wave often comes with noticeable momentum, acting against the dominant trend. Following this, Gray Wave C is projected to begin in a smaller degree sequence.
With Navy Blue Wave C now taking shape, the technical outlook for NTPC points to increased price volatility and potential trend reversals. Traders should remain alert for signs of wave completion, as this phase could represent the final push in the counter-trend cycle.
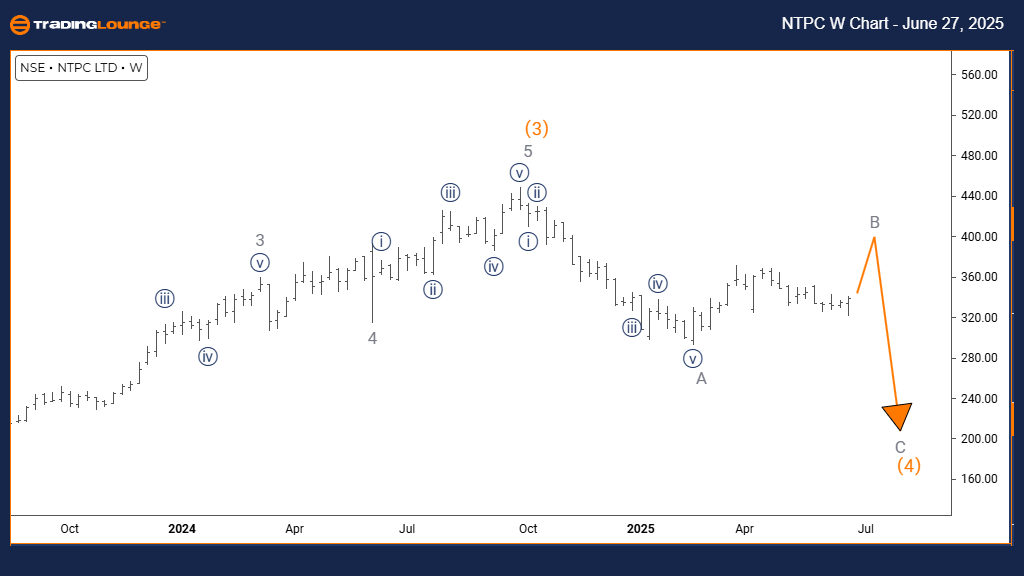
NTPC Elliott Wave Analysis | Trading Lounge Weekly Chart
NTPC Elliott Wave Technical Analysis
FUNCTION: Counter Trend
MODE: Corrective
STRUCTURE: Gray Wave B
POSITION: Orange Wave 4
DIRECTION NEXT LOWER DEGREES: Gray Wave C
DETAILS: Gray Wave A seems complete; Gray Wave B is currently forming.
The weekly NTPC Elliott Wave forecast illustrates a corrective trend developing within a larger market structure. Currently, price action is unfolding as Gray Wave B, placed within Orange Wave 4, indicating a temporary retracement before a potential continuation of the main trend.
Based on this wave count, Gray Wave A has ended, and Gray Wave B is underway. This wave typically retraces a part of the previous move and is expected to be followed by Gray Wave C, which often resumes the dominant market trend after the corrective phase.
The NTPC chart setup currently emphasizes a sideways or slightly downward movement, aligning with the typical behavior of Gray Wave B. Its location within Orange Wave 4 underlines that this is a segment of an extended correction pattern, which is commonly observed during fourth waves.
Traders monitoring NTPC stock should keep a close watch on the development of Gray Wave B. Upon its conclusion, Gray Wave C may begin, signaling a potential return to the primary trend and offering directional clarity in the near term.
Technical Analyst: Malik Awais
Source: Visit Tradinglounge.com and learn from the Experts. Join TradingLounge Here
Previous: BHARAT ELECTRONICS Elliott Wave Technical Analysis
VALUE Offer - Buy 1 Month & Get 3 Months!Click here
Access 7 Analysts Over 200 Markets Covered. Chat Room With Support