USD/CAD Elliott Wave Analysis Trading Lounge Day Chart, 23 February 24
U.S.Dollar /Canadian Dollar(USD/CAD) Day Chart
USD/CAD Elliott Wave Technical Analysis
FUNCTION: Counter Trend
MODE: impulsive
STRUCTURE: blue wave 5
POSITION: black wave C
DIRECTION NEXT LOWER DEGREES: blue wave 5 (started)
DETAILS: red wave Y of blue wave 4 looking completed at 1.35895. Now blue wave 5 of C is in play . Wave Cancel invalid level:1.36335
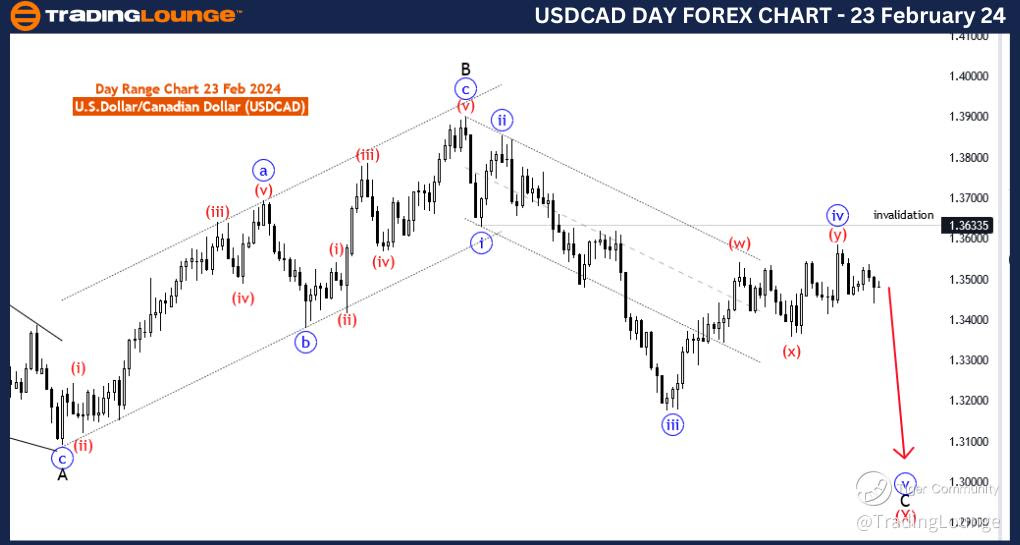
The "USD/CAD Elliott Wave Analysis Trading Lounge Day Chart" dated 23 February 24, offers a comprehensive analysis of the U.S. Dollar/Canadian Dollar (USD/CAD) currency pair, employing Elliott Wave principles to gain insights into potential market dynamics. This analysis centers on a daily chart, providing a broader perspective for a more extended timeframe.
The identified "FUNCTION" is "Counter Trend," indicating a focus on potential reversal or correction against the prevailing trend. This suggests that, at least in the short term, the analysis anticipates a counter-directional move against the primary trend.
The specified "MODE" is "Impulsive," signifying that despite the counter-trend nature, the current market conditions are characterized by strong and forceful price movements. Impulsive waves are often associated with decisive and swift market actions.
The described "STRUCTURE" is "Blue wave 5," denoting the current position within the larger Elliott Wave pattern. Wave 5 typically represents the final move in the sequence, and its completion often marks the end of a trend or a larger degree wave.
The designated "POSITION" is "Black wave C," highlighting the specific wave in the Elliott Wave hierarchy. Black wave C is often a part of a larger corrective structure, and understanding its position aids in anticipating potential market movements.
In terms of "DIRECTION NEXT LOWER DEGREES," the analysis emphasizes "Blue wave 5 (started)," suggesting the initiation of the sub-waves within the broader blue wave 5.
The "DETAILS" section specifies that "red wave Y of blue wave 4 looking completed at 1.35895. Now blue wave 5 of C is in play." This indicates the completion of a corrective phase (red wave Y) and the beginning of the impulsive move (blue wave 5 of C).
The "Wave Cancel invalid level" is set at 1.36335. This level serves as a critical reference point for traders, representing the threshold beyond which the current wave count would be considered invalid.
In summary, the USD/CAD Elliott Wave Analysis for the daily chart on 23 February 24, suggests a counter-trend scenario, with blue wave 5 of C in progress. Traders are advised to monitor the development of this wave and consider the invalidation level at 1.36335.
USD/CAD Elliott Wave Analysis Trading Lounge 4 Hour Chart, 23 February 24
U.S.Dollar /Canadian Dollar(USD/CAD) 4 Hour Chart
USD/CAD Elliott Wave Technical Analysis
FUNCTION: Trend
MODE: impulsive
STRUCTURE: Red wave 3
POSITION: Blue wave 5
DIRECTION NEXT HIGHER DEGREES: Red wave 4
DETAILS: red wave 2 of blue wave 5 looking completed at 1.35402 . Now red wave 3 of 5 is in play . Wave Cancel invalid level:1.35846
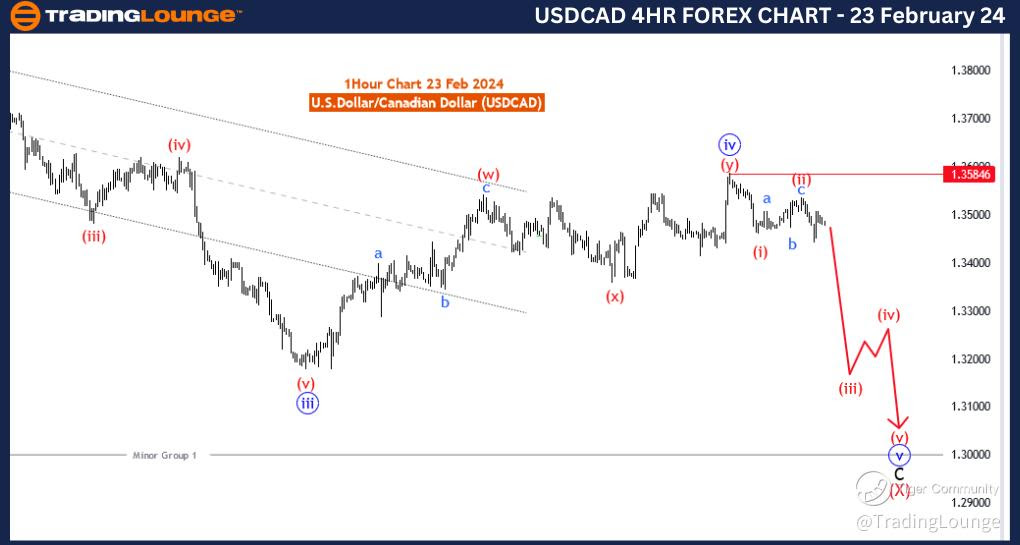
The "USD/CAD Elliott Wave Analysis Trading Lounge 4 Hour Chart" dated 23 February 24, provides an in-depth analysis of the U.S. Dollar/Canadian Dollar (USD/CAD) currency pair, utilizing Elliott Wave principles to derive insights into potential market movements. This analysis focuses on a 4-hour chart, allowing for a more detailed examination of short to intermediate-term trends.
The identified "FUNCTION" is "Trend," indicating a primary emphasis on understanding and capitalizing on the prevailing directional movement in the market. Recognizing the trend is crucial for traders to align their strategies with the predominant market sentiment.
The specified "MODE" is "Impulsive," suggesting that the market is currently characterized by strong, directional price movements. Impulsive waves are indicative of the core trend, and traders often seek to identify entry points during such phases.
The described "STRUCTURE" is "Red wave 3," highlighting the current phase within the Elliott Wave sequence. Wave 3 is typically one of the most significant and powerful waves in a trend, signifying a strong directional movement.
The designated "POSITION" is "Blue wave 5," indicating the current placement within the broader Elliott Wave pattern. Wave 5 is typically the final wave in the sequence and is closely watched by traders as it often marks the culmination of a trend.
In terms of "DIRECTION NEXT HIGHER DEGREES," the analysis emphasizes "Red wave 4," suggesting an anticipated corrective wave following the completion of the impulsive Red wave 3.
The "DETAILS" section specifies that "Red wave 2 of blue wave 5 looking completed at 1.35402. Now red wave 3 of 5 is in play." This implies the end of a corrective phase (wave 2) and the initiation of the powerful impulsive wave 3 of 5.
The "Wave Cancel invalid level" is set at 1.35846. This level is crucial for traders, representing the point at which the current wave count would be invalidated.
In summary, the USD/CAD Elliott Wave Analysis for the 4-hour chart on 23 February 24, indicates a strong impulsive trend, with the market commencing Red wave 3 of 5. Traders are advised to monitor the development of this wave and be mindful of the invalidation level at 1.35846.
Technical Analyst: Malik Awais
Source: visit Tradinglounge.com and learn From the Experts Join TradingLounge Here
See Previous: EURUSD