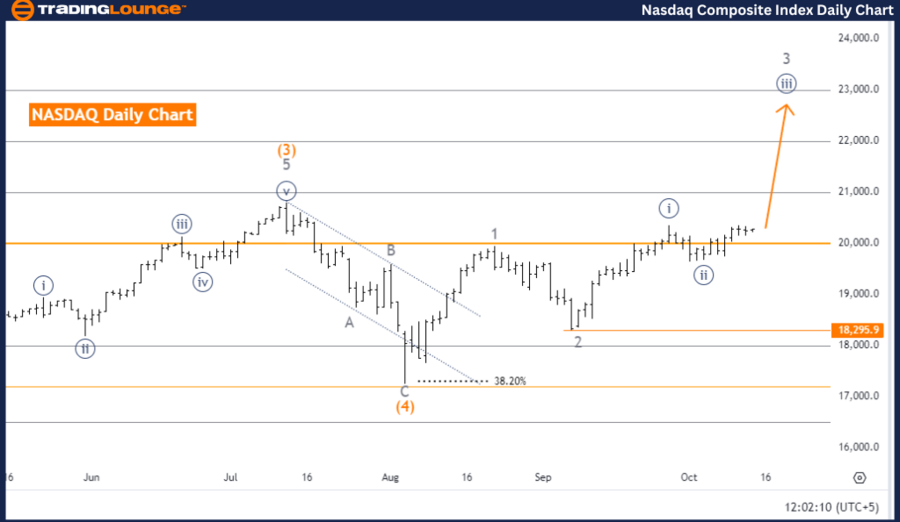
NASDAQ Elliott Wave Analysis – Trading Lounge Day Chart

NASDAQ Elliott Wave Technical Analysis

Function: Trend

Mode: Impulsive

Structure: Navy Blue Wave 3

Position: Gray Wave 3

Next Lower Degree: Navy Blue Wave 4

Wave Invalidation Level: 18,295.9

NASDAQ Analysis Overview

The NASDAQ Elliott Wave analysis on the daily chart indicates the market is in a bullish trend. The current structure follows an impulsive pattern, unfolding as Navy Blue Wave 3. This advanced stage within Gray Wave 3 suggests increasing momentum, aligning with the theory that wave three trends exhibit robust and extended upward movement.

NASDAQ Wave Structure & Position

  • Navy Blue Wave 2 has been completed, paving the way for Navy Blue Wave 3, which signifies ongoing upward strength. This phase typically supports continued bullish momentum.

  • Upon the conclusion of Navy Blue Wave 3, the market will likely move into Navy Blue Wave 4, signaling a potential temporary correction before resuming its broader uptrend.

NASDAQ Key Details

  • Current Market Status: The market has confirmed the end of Navy Blue Wave 2, with Navy Blue Wave 3 now active and driving upward momentum.

  • Wave Cancel Invalidation: If the market falls below 18,295.9, the current wave analysis becomes invalid, requiring a revised outlook.

Summary

The NASDAQ remains in a strong bullish phase, supported by Navy Blue Wave 3. Analysts can expect further gains as long as the market trades above 18,295.9. Potential corrections may arise during the shift into Navy Blue Wave 4, but the overall uptrend remains intact.

NASDAQ-composite-Ind...


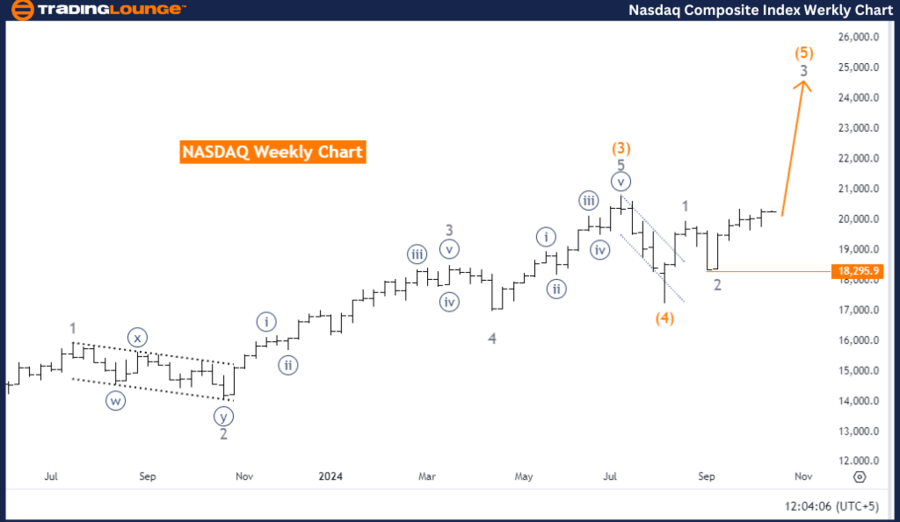
NASDAQ Elliott Wave Analysis – Trading Lounge Weekly Chart

NASDAQ Index Elliott Wave Technical Analysis

Function: Trend

Mode: Impulsive

Structure: Gray Wave 3

Position: Orange Wave 5

Next Lower Degree: Gray Wave 4

Wave Invalidation Level: 18,295.9

NASDAQ Index Analysis Overview

The weekly Elliott Wave analysis shows the NASDAQ is in a strong upward trend with an impulsive structure. This movement within Gray Wave 3 has progressed to Orange Wave 5, indicating the impulse sequence is entering later stages.

NASDAQ Index Wave Structure & Position

  • Gray Wave 2 is complete, and the market is now within Gray Wave 3, a phase known for strong bullish momentum.

  • Following the conclusion of Gray Wave 3, the market is projected to transition into Gray Wave 4, which might bring a temporary pullback before the bullish trend resumes.

NASDAQ Index Key Details

  • Current Market Status: Gray Wave 3 is still unfolding, pointing to continued upward momentum in the near term.

  • Wave Cancel Invalidation: If the market drops below 18,295.9, the current wave count will need a reassessment, as it will be invalidated.

Summary

The NASDAQ's bullish trend remains intact, with Gray Wave 3 leading the market higher. Traders should anticipate further gains while preparing for a corrective phase during Gray Wave 4. As long as the market remains above 18,295.9, the uptrend outlook stays valid.

Technical Analyst: Malik Awais

Source: visit Tradinglounge.com and learn From the Experts Join TradingLounge Here 

Previous: Bovespa Index Elliott Wave Technical Analysis

VALUE Offer - Buy 1 Month & Get 3 Months!Click here

Access 7 Analysts Over 200 Markets Covered. Chat Room With Support

NASDAQ-composite-Ind...

Related

Dogecoin (DOGEUSD) Elliott Wave Technical Analysis: Bullish Impulse Signals Uptrend Continuation

Dogecoin (DOGEUSD) Elliott Wave Technical Analysis: Bullish Impulse Signals Uptrend Continuation

In this analysis, we explore Dogecoin's trading dynamics using Elliott Wave Theory. With a focus...

Read More >
U.S. Dollar / Canadian Dollar Forex Pair - Elliott Wave Technical USDCAD Analysis Offers Valuable Insights for your Trading Strategy

U.S. Dollar / Canadian Dollar Forex Pair - Elliott Wave Technical USDCAD Analysis Offers Valuable Insights for your Trading Strategy

This article provides an in-depth analysis of USDCAD using the Elliott Wave theory. It covers both i...

Read More >
The Coca-Cola Company (KO) Stocks Elliott Wave Technical Analysis to make Decisions based on the latest Market Structure

The Coca-Cola Company (KO) Stocks Elliott Wave Technical Analysis to make Decisions based on the latest Market Structure

Discover a detailed Elliott Wave analysis for Coca-Cola (KO) stock, providing insights into potentia...

Read More >
Theta Token/U.S. dollar(THETAUSD) Elliott Wave Technical Analysis 30 October 23

Theta Token/U.S. dollar(THETAUSD) Elliott Wave Technical Analysis 30 October 23

Elliott Wave Analysis TradingLounge Daily Chart, 30 October 23,Theta Token/U.S. dollar(THETAUSD)THET...

Read More >
Elliott Wave Outlook: Key Stock Market Indices Ahead of Federal Reserve Decision

Elliott Wave Outlook: Key Stock Market Indices Ahead of Federal Reserve Decision

**Stock Market Indices Overview: S&P 500, NASDAQ 100, RUSSELL 2000, DAX 40, FTSE 100, ASX 200 - Feat...

Read More >
Adani Enterprises Ltd Stock Analysis and ADANIENT Elliott Wave Analysis With a Focus on Technical Indicators and Market Trends

Adani Enterprises Ltd Stock Analysis and ADANIENT Elliott Wave Analysis With a Focus on Technical Indicators and Market Trends

This article provides an in-depth Elliott Wave analysis of Adani Enterprises Ltd, highlighting poten...

Read More >

Buy 1 Month

Get 3 Months!

Special Offer:

Trade Recommendations

Unleash the power of deversified trading with our comprehensive portfolio, covering:

  • Stock Trades
  • Crypto Trades
  • Forex Trades
  • Commodity Trades
Elliott Wave Analysis

Gain a competive edge with expert insights in to:

  • Global Indices
  • US Stocks & ASX Stocks
  • Forex & Crypto
  • Commodities
Top-Notch Trading Tools

Equip yourself with the tools of success:

  • Social Chat
  • Elliott Wave Algorithm
  • Screener
  • TradingLevels
  • Trading Game
7 Elliott Wave Analysts

Stay ahead of the market with daily charts and insightful videos
-Your secret to strategic trading!

JOIN HERE


Welcome to TradingLounge (ASIC A.R.No. 321187), specialists in trades, trading education and technical analysis, covering stocks, indices, commodities, forex and cryptocurrencies.

When you join TradingLounge you have access to everything we offer, including trade tools, educational content and a social platform to chat with like-minded investors.

Read more

@Copyright 2024 by tradinglounge.com

Contact Us

Australian no: 02 4787 6020

International no: +61 (2) 47876020

Pay with:

Find us on