Bovespa Index Elliott Wave Analysis – Trading Lounge Day Chart
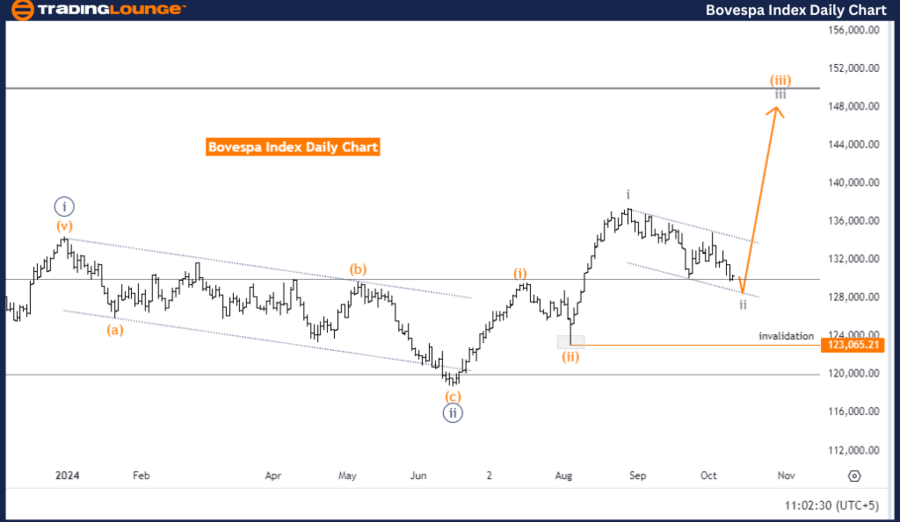
Bovespa Index Daily Chart Analysis
Bovespa Index Elliott Wave Technical Analysis
Function: Counter Trend
Mode: Corrective
Structure: Gray wave 2
Position: Orange wave 3
Direction (Next Higher Degrees): Gray wave 3
Details: Gray wave 1 appears completed; gray wave 2 is currently unfolding and nearing its conclusion.
Wave Cancel/Invalidation Level: 123065.21
Summary:
The Elliott Wave analysis of the Bovespa Index on the daily chart highlights a counter-trend currently in a corrective mode. The structure is situated in gray wave 2, which follows the completion of gray wave 1. The index is positioned within orange wave 3, suggesting the corrective phase could soon end, paving the way for a bullish continuation.
The anticipated movement aligns with gray wave 3, indicating that after gray wave 2 concludes, the market could resume its upward trend. With gray wave 1 already completed and gray wave 2 nearing its end, this signals that the corrective wave is almost over. The next phase is likely a bullish continuation as gray wave 3 begins.
During the current corrective phase, the market has experienced consolidation or a pullback. Once gray wave 2 ends, the impulsive phase, driven by orange wave 3, is expected to resume. The wave cancel/invalidation level is at 123065.21—if the index drops below this level, the current wave count becomes invalid.
In conclusion, the Bovespa Index remains in a corrective phase with gray wave 2 nearing completion. Once this phase ends, the index may transition into gray wave 3, resuming the upward momentum seen in orange wave 3. The wave count remains valid as long as the index holds above 123065.21.
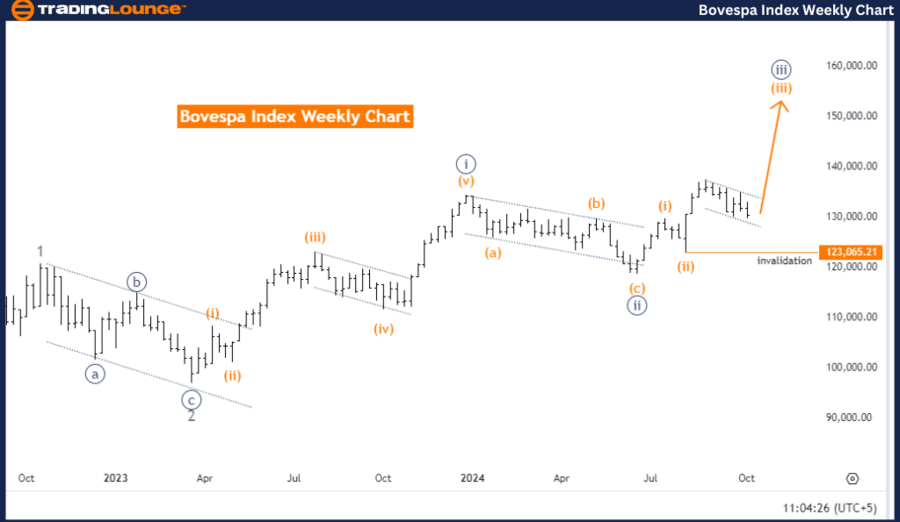
Bovespa Index Elliott Wave Analysis – Trading Lounge Weekly Chart
Bovespa Index Elliott Wave Technical Analysis
Function: Trend
Mode: Impulsive
Structure: Orange wave 3
Position: Navy blue wave 3
Direction (Next Lower Degrees): Orange wave 4
Details: Orange wave 2 has completed; orange wave 3 is currently unfolding.
Wave Cancel/Invalidation Level: 123065.21
Summary:
The Elliott Wave analysis of the Bovespa Index on the weekly chart shows a strong upward trend in impulsive mode. The current structure is in orange wave 3, which follows the conclusion of orange wave 2. The index is now in navy blue wave 3, signaling that the bullish momentum may continue.
As orange wave 3 progresses, the next lower degree of movement, orange wave 4, could initiate a corrective phase after the current impulsive wave peaks. The analysis confirms that orange wave 2 has completed and orange wave 3 is actively unfolding, driving the index higher.
The market is currently in an impulsive phase, with potential for further gains as orange wave 3 pushes the index upward. After orange wave 3 peaks, a correction may follow in orange wave 4, before resuming the upward trend.
The wave cancel/invalidation level is at 123065.21—should the index drop below this level, the current wave count will be invalidated, signaling a shift in market direction. As long as the index stays above this level, the bullish Elliott Wave count remains intact.
In conclusion, the Bovespa Index is experiencing an impulsive upward move driven by orange wave 3. The market is expected to continue rising before entering a corrective phase in orange wave 4. The trend remains valid as long as the index stays above 123065.21.
Technical Analyst: Malik Awais
Source: visit Tradinglounge.com and learn From the Experts Join TradingLounge Here
Previous: DAX 40 Elliott Wave Technical Analysis
VALUE Offer - Buy 1 Month & Get 3 Months!Click here
Access 7 Analysts Over 200 Markets Covered. Chat Room With Support