Explore the latest Elliott Wave Analysis for Binance Coin / U.S. dollar (BNBUSD) with our expert Tradinglounge analyst. Gain valuable insights into the current market trends, technical indicators, and potential trading strategies. Discover how BNBUSD is positioned within the Elliott Wave framework and learn about the exciting trading opportunities that may arise.

Elliott Wave Technical Analysis - Unraveling BNBUSD Trends

Delve into the intricacies of BNBUSD Elliott Wave Analysis as we examine its daily and 4-hour charts on February 9, 2024. Our focus lies on identifying the counter-trend, corrective structure, and potential trading strategies.

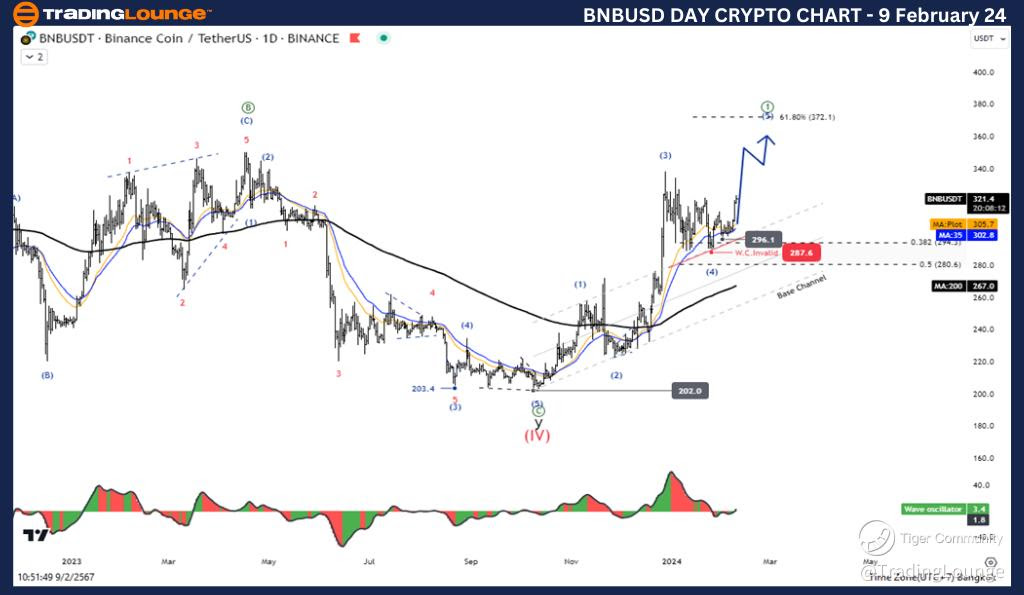
Daily Chart Analysis: Wave 4 Correction and Wave 5 Anticipation

On the daily chart, BNBUSD is currently exhibiting a counter-trend movement in the form of a corrective zigzag structure. Positioned at Wave 4, the ongoing correction may have reached completion, paving the way for an imminent price surge in Wave 5.

Key Insights:

  • Function: Counter Trend
  • Mode: Corrective
  • Structure: Zigzag
  • Position: Wave 4
  • Direction Next higher Degrees: Wave ((1)) of Impulse
  • Wave Cancel invalid level: 202.8

Trading Strategy: Anticipate another upward move in Wave (5) post the conclusion of Wave (4). A price target of 372.1 is envisioned, aligning with the 0.618 Fibonacci retracement level of the length between Wave (1) and Wave (3). This projection signals the continuation of Binance's uptrend, suggesting further potential for price escalation.

Technical Indicators: The daily chart reflects a strong uptrend, with the price comfortably positioned above the MA200, indicating a bullish momentum. Wave oscillators further confirm the positive outlook for BNBUSD, supporting the likelihood of an upward price trajectory.

BNBUSD-Day-Crypto-Ch...


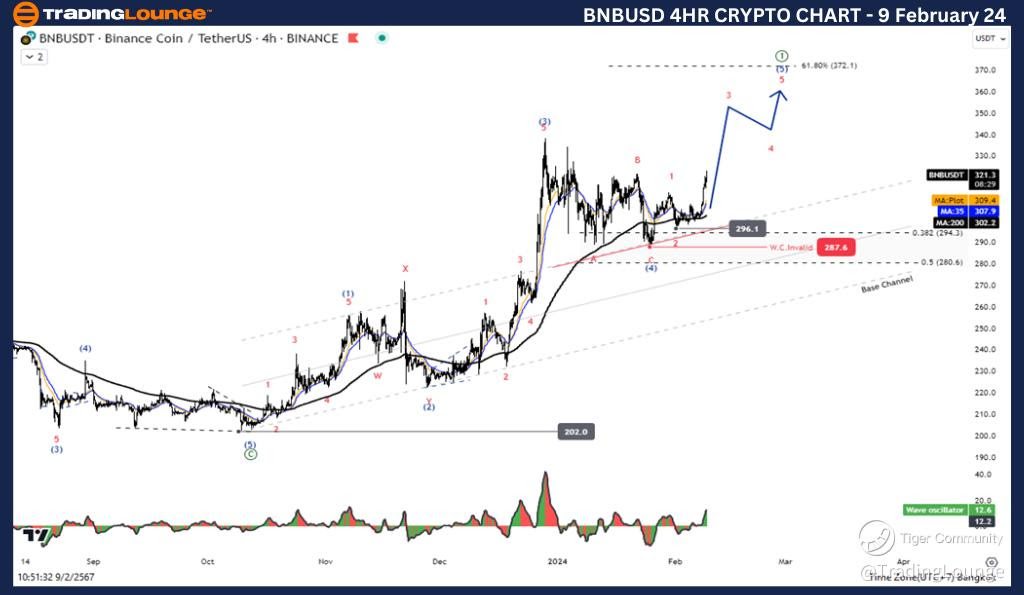
4-Hour Chart Analysis: Confirming the Wave 4 Correction

Zooming into the 4-hour chart provides a closer look at the ongoing corrective Wave 4. As mentioned earlier, the correction appears to be concluding, setting the stage for a subsequent surge in Wave 5.

Key Insights:

  • Function: Counter Trend
  • Mode: Corrective
  • Structure: Zigzag
  • Position: Wave 4
  • Direction Next higher Degrees: Wave ((1)) of Impulse
  • Wave Cancel invalid level: 202.8

Trading Strategy: Reiterate the expectation for a rise in Wave (5) post Wave (4) completion. The 372.1 price target remains intact, aligning with the 0.618 Fibonacci retracement level. This reinforces the overall bullish sentiment surrounding BNBUSD, suggesting potential gains shortly.

Technical Indicators: Consistency prevails on the 4-hour chart, with the price comfortably above the MA200, affirming the prevailing uptrend. Wave oscillators maintain a bullish momentum, providing additional confirmation of the positive outlook for Binance Coin.

Analyst Insights: Provided by Kittiampon Somboonsod, CEWA, from TradingLounge.

Source: visit Tradinglounge.com and learn From the Experts Join TradingLounge Here 

See Previous: AAVE / U.S. dollar(AAVEUSD)

BNBUSD-4Hr-Crypto-Ch...


Related

British Pound/ Australian Dollar(GBPAUD) Forex Elliott Wave Technical Analysis: Insightful Day and 4-Hour Chart Perspectives

British Pound/ Australian Dollar(GBPAUD) Forex Elliott Wave Technical Analysis: Insightful Day and 4-Hour Chart Perspectives

This article provides a detailed GBPAUD Elliott Wave Analysis, utilizing both day and 4-hour charts ...

Read More >
EURGBP Elliott WaveTechnical Analysis: Bearish Trend, Orange Wave 3 Progression, Risk Management Insights, and Forex Trading Strategies

EURGBP Elliott WaveTechnical Analysis: Bearish Trend, Orange Wave 3 Progression, Risk Management Insights, and Forex Trading Strategies

This comprehensive analysis delves into EURGBP Elliott Wave structures, highlighting the ongoing bea...

Read More >
Commodity Market Update: Forecast for Gold, Silver, and Base Metals Amid Rising US Dollar and Treasury Yields

Commodity Market Update: Forecast for Gold, Silver, and Base Metals Amid Rising US Dollar and Treasury Yields

This commodity market update highlights expectations for key financial instruments and commodities i...

Read More >
Costco Wholesale Corp. (COST) Daily Chart Analysis Using Elliott Wave Theory - February 2nd, 2024

Costco Wholesale Corp. (COST) Daily Chart Analysis Using Elliott Wave Theory - February 2nd, 2024

Gain insights into COST Elliott Wave analysis for Costco Wholesale Corp. (COST) on February 24, 2024...

Read More >
New Zealand Dollar/U.S.Dollar(NZDUSD) Forex Elliott Wave Technical Analysis: In-Depth Overview for Traders

New Zealand Dollar/U.S.Dollar(NZDUSD) Forex Elliott Wave Technical Analysis: In-Depth Overview for Traders

Elliott Wave analysis of the NZDUSD currency pair, covering day and 4-hour charts highlights key tre...

Read More >

$1 for 2 Weeks

then $29 a month!

What a Special Offer!

Trade Recommendations

Unleash the power of deversified trading with our comprehensive portfolio, covering 250+ markets:

  • Stock Trades
  • Crypto Trades
  • Forex Trades
  • Commodity Trades
Elliott Wave Analysis

Gain a competitive edge with expert insights and AI-powered Elliott Wave charting into:

  • Global Indices
  • US Stocks & ASX Stocks
  • Forex & Crypto
  • Commodities
Top-Notch Trading Tools

Equip yourself with the tools of success:

  • Real-time Chat rooms
  • Elliott Wave Algorithm
  • Portfolio tools
  • TradingLevels
  • Screener
  • Trading Game
7 Elliott Wave Analysts

Stay ahead of the market with daily charts and insightful videos
Your secret to strategic trading!

JOIN HERE


Welcome to TradingLounge (ASIC A.R.No. 321187), specialists in trades, trading education and technical analysis, covering stocks, indices, commodities, forex and cryptocurrencies.

When you join TradingLounge you have access to everything we offer, including trade tools, educational content and a social platform to chat with like-minded investors.

Read more

@Copyright 2024 by tradinglounge.com

Contact Us

Australian no: 02 4787 6020

International no: +61 (2) 47876020

Pay with:

Find us on