12May

CAR GROUP LIMITED – CAR Elliott Wave Analysis Indicates Potential Bullish Wave (5) with Key Support at 31.73

ASX: CAR GROUP LIMITED – CAR Elliott Wave Technical Analysis

TradingLounge 

Welcome to today’s Elliott Wave analysis for CAR GROUP LIMITED (ASX: CAR). Our current evaluation suggests that CAR has completed a corrective wave (4) in orange, characterized by a classic Zigzag formation. This development potentially signals the start of a bullish impulsive wave (5). In this brief overview, we explore possible future price movements and crucial invalidation levels to monitor.


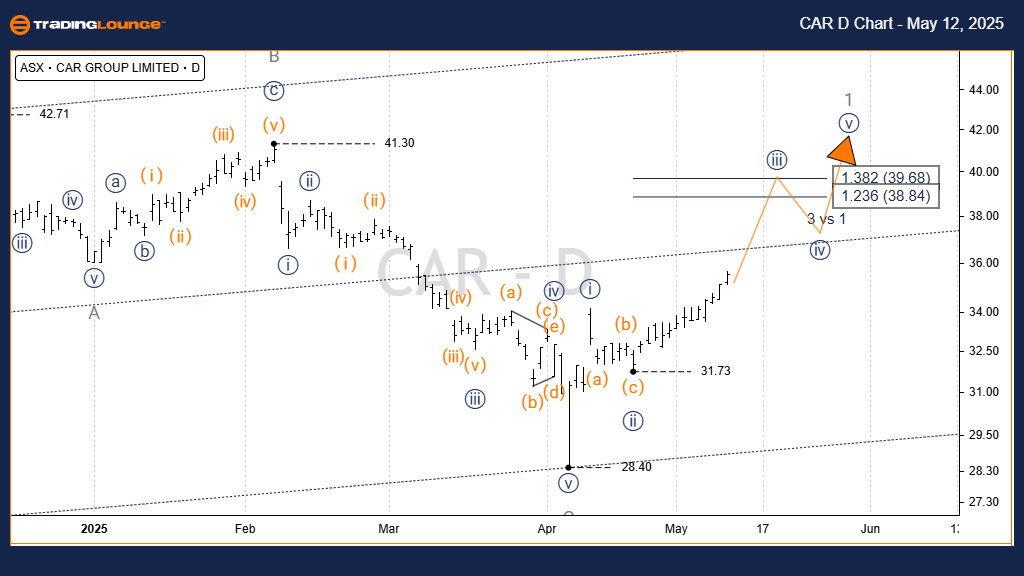
ASX: CAR GROUP LIMITED – CAR Elliott Wave Analysis 1D Chart (Semilog Scale) – Technical Overview

Function: Major Trend (Intermediate degree, orange)

Wave Mode: Motive

Structure Type: Impulse

Current Position: Wave iii)) – navy within Wave (5) – orange

Key Insights:

  • The corrective wave (4) – orange began after the peak at 42.71 and may have bottomed at 28.40.
  • This structure presents an A-B-C Zigzag, where wave C – grey shows five defined sub-waves, supporting a completed correction.
  • As a result, wave (5) – orange appears to be unfolding, with wave iii)) – navy gaining traction.
  • Near-term bullish targets are in the 39.68 to 40.00 range.

Invalidation Level: 31.73
(Price action must stay above this level to maintain bullish structure.)

CAR-GROUP-d-asx-char...


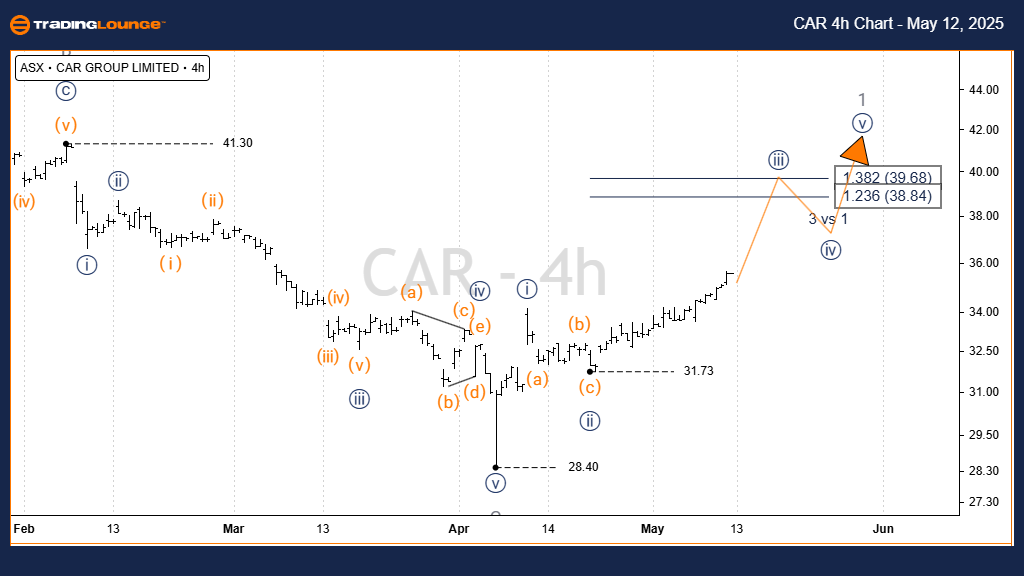
ASX: CAR GROUP LIMITED – CAR 4-Hour Elliott Wave Chart

Short-Term Trend Overview

Function: Major Trend (Minor degree, grey)

Wave Mode: Motive

Structure Type: Impulse

Current Position: Wave ((iii)) – navy of Wave (5) – orange

Key Insights:

  • A confirmed breakout above 31.73 initiated the development of wave iii)) – navy.
  • Continued price action above 31.73 confirms this bullish trend.

Invalidation Level: 31.73
(A drop below this level would invalidate the current wave count.)

Technical Analyst: Hua (Shane) Cuong, CEWA-M (Master’s Designation).

Source: Visit Tradinglounge.com and learn from the Experts. Join TradingLounge Here 

See Previous: Insurance Australia Group Limited (IAG) Elliott Wave Technical Analysis

VALUE Offer - Buy 1 Month & Get 3 Months!Click here

Access 7 Analysts Over 200 Markets Covered. Chat Room With Support

CAR-GROUP-4h-asx-cha...


Conclusion

This Elliott Wave technical analysis for ASX: CAR provides a comprehensive view of both medium and short-term market trends. By outlining precise validation and invalidation price points, traders gain more confidence in the forecast. The objective is to assist market participants with actionable insights to navigate the evolving price structure of CAR GROUP LIMITED.

Related

Comprehensive Elliott Wave Analysis: S&P 500, NASDAQ 100, DAX 40, and More - June 2024 Market Insights

Comprehensive Elliott Wave Analysis: S&P 500, NASDAQ 100, DAX 40, and More - June 2024 Market Insights

Today's analysis covers key stock market indices including the S&P 500, NASDAQ 100, Russell 2000...

Read More >
Uranium - GX URA Commodity Elliott Wave Technical Analysis Reveals Bullish Trend, Key Levels, and Smart Trade Setups

Uranium - GX URA Commodity Elliott Wave Technical Analysis Reveals Bullish Trend, Key Levels, and Smart Trade Setups

Elliott Wave analysis for GX Uranium ETF (URA), identifying bullish momentum and upcoming support-ba...

Read More >
In-Depth Euro/British Pound Forex Elliott Wave Technical Analysis: Mastering EURGBP Trading

In-Depth Euro/British Pound Forex Elliott Wave Technical Analysis: Mastering EURGBP Trading

Dive into our comprehensive Elliott Wave analysis of the EURGBP currency pair. This article provides...

Read More >
Corn Commodity Elliottwave Technical Analysis:  Corn Price Forecast and Market Trends

Corn Commodity Elliottwave Technical Analysis: Corn Price Forecast and Market Trends

This article provides an in-depth analysis of the corn market trends expected in 2024, focusing on E...

Read More >
S&P BSE Sensex (INDIA) Elliott Wave Analysis: Exploring Gray Wave C and Orange Wave 4 in the Current Counter-Trend Movement

S&P BSE Sensex (INDIA) Elliott Wave Analysis: Exploring Gray Wave C and Orange Wave 4 in the Current Counter-Trend Movement

The S&P BSE Sensex Elliott Wave analysis identifies a counter-trend phase with Gray Wave C actively ...

Read More >
Australian Dollar/U.S. Dollar (AUDUSD) Elliott Wave Analysis for Daily and 4-Hour Charts Featuring Forecast, and Key Technical Levels

Australian Dollar/U.S. Dollar (AUDUSD) Elliott Wave Analysis for Daily and 4-Hour Charts Featuring Forecast, and Key Technical Levels

AUDUSD Elliott Wave technical analysis provides a detailed breakdown of the current wave structure o...

Read More >

$1 for 2 Weeks

then $29 a month!

What a Special Offer!

Trade Recommendations

Unleash the power of deversified trading with our comprehensive portfolio, covering 250+ markets:

  • Stock Trades
  • Crypto Trades
  • Forex Trades
  • Commodity Trades
Elliott Wave Analysis

Gain a competitive edge with expert insights and AI-powered Elliott Wave charting into:

  • Global Indices
  • US Stocks & ASX Stocks
  • Forex & Crypto
  • Commodities
Top-Notch Trading Tools

Equip yourself with the tools of success:

  • Real-time Chat rooms
  • Elliott Wave Algorithm
  • Portfolio tools
  • TradingLevels
  • Screener
  • Trading Game
7 Elliott Wave Analysts

Stay ahead of the market with daily charts and insightful videos
Your secret to strategic trading!

JOIN HERE


Welcome to TradingLounge (ASIC A.R.No. 321187), specialists in trades, trading education and technical analysis, covering stocks, indices, commodities, forex and cryptocurrencies.

When you join TradingLounge you have access to everything we offer, including trade tools, educational content and a social platform to chat with like-minded investors.

Read more

@Copyright 2024 by tradinglounge.com

Contact Us

Australian no: 02 4787 6020

International no: +61 (2) 47876020

Pay with:

Find us on