Australian Dollar/U.S. Dollar Currency Pair - Trading Lounge Day Chart
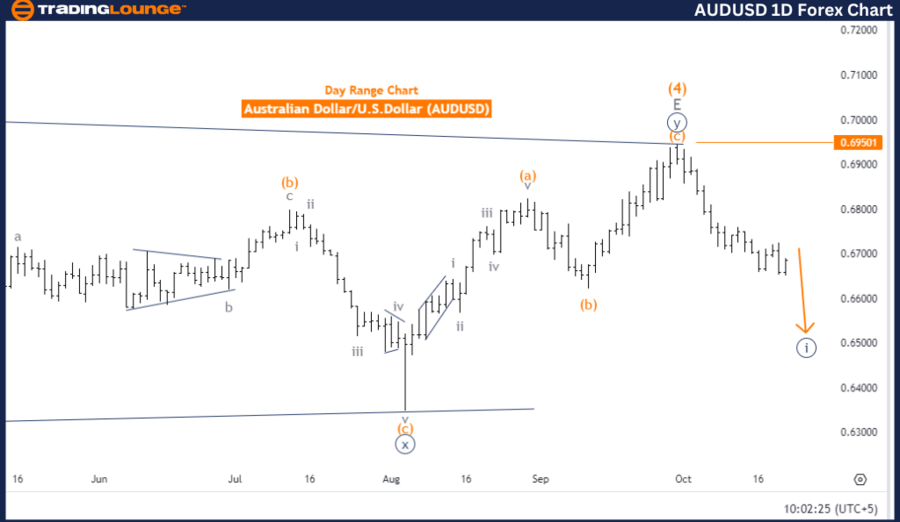
Australian Dollar/U.S. Dollar (AUDUSD) Day Chart
AUDUSD Elliott Wave Technical Analysis
Function: Bearish Trend
Mode: Impulsive
Structure: Navy Blue Wave 1
Position: Gray wave 1
Next Higher Degree: Navy Blue Wave 2
Details: The daily Elliott Wave analysis for AUDUSD indicates a clear bearish trend in an impulsive mode. The market is currently within navy blue wave 1, representing the first phase of a more significant downward trend.
Currently, the market is positioned in gray wave 1 within the navy blue wave 1 structure. This signals that the initial downtrend phase is still unfolding, with Navy Blue Wave 1 nearing completion but not yet finalized.
Once Navy Blue Wave 1 ends, the market is projected to enter Navy Blue Wave 2, a corrective phase. This will likely lead to a pullback or temporary market reversal, offering some short-term relief from the ongoing bearish momentum before the downtrend resumes.
Key Level:
The wave cancellation level is set at 0.69501, a crucial price point. Should the market move above this level, it would invalidate the current Elliott Wave count and necessitate a review of the overall structure.
Summary:
The AUDUSD daily chart displays a continuing bearish trend, with navy blue wave 1 approaching completion. The market is currently positioned in gray wave 1, which is part of the broader navy blue wave 1 structure. Once navy blue wave 1 concludes, a corrective navy blue wave 2 is expected. Watch the 0.69501 price level closely, as exceeding this level would invalidate the current wave count.

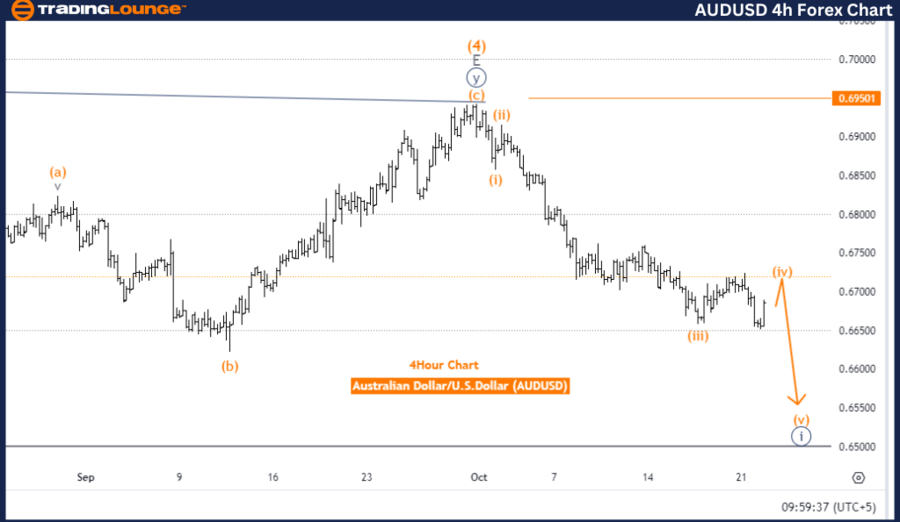
TreadingLounge Australian Dollar/U.S. Dollar (AUDUSD) 4-Hour Chart
AUDUSD Elliott Wave Technical Analysis
Function: Counter Trend
Mode: Corrective
Structure: Orange wave 4
Position: Navy blue wave 1
Next Lower Degree: Orange wave 5
Details:
The 4-hour Elliott Wave analysis for AUDUSD shows a counter-trend scenario, suggesting a corrective phase within the broader market structure. The market is currently experiencing orange wave 4, a corrective move following the completion of orange wave 3.
The market is positioned in navy blue wave 1, part of the larger orange wave sequence. With orange wave 3 finished, the market is undergoing orange wave 4, a temporary pullback in the overall bearish trend. Once orange wave 4 concludes, the market is expected to resume its downward movement in orange wave 5.
Traders are monitoring orange wave 4 closely for signs that it is nearing completion, which would suggest the market is preparing for the next bearish impulse, orange wave 5.
Wave Cancellation Level:
The wave cancellation level is set at 0.69501. If the market rises above this level, it would invalidate the current wave count and require a reevaluation of the market structure.
Summary:
The AUDUSD 4-hour chart reflects a corrective phase with orange wave 4 unfolding after the completion of orange wave 3. The broader trend remains bearish, and once orange wave 4 finishes, the market is expected to continue downward into orange wave 5. The critical level to watch is 0.69501—staying below this level aligns with the current Elliott Wave count.
Technical Analyst: Malik Awais
Source: visit Tradinglounge.com and learn From the Experts Join TradingLounge Here
Previous: Euro / U.S. Dollar (EURUSD)) Elliott Wave Technical Analysis
VALUE Offer - Buy 1 Month & Get 3 Months!Click here
Access 7 Analysts Over 200 Markets Covered. Chat Room With Support
