23Nov

Visa Inc. (V) Stocks Elliott Wave Technical Analysis: Stock Trends, and Price Forecasts to Refine Your Trading Decisions

Visa Inc. (V) Elliott Wave Analysis: A Detailed Technical Outlook

This article delves into the Elliott Wave Analysis of Visa Inc. (V) using insights from the daily and 1-hour charts to evaluate current trends and project future price movements.

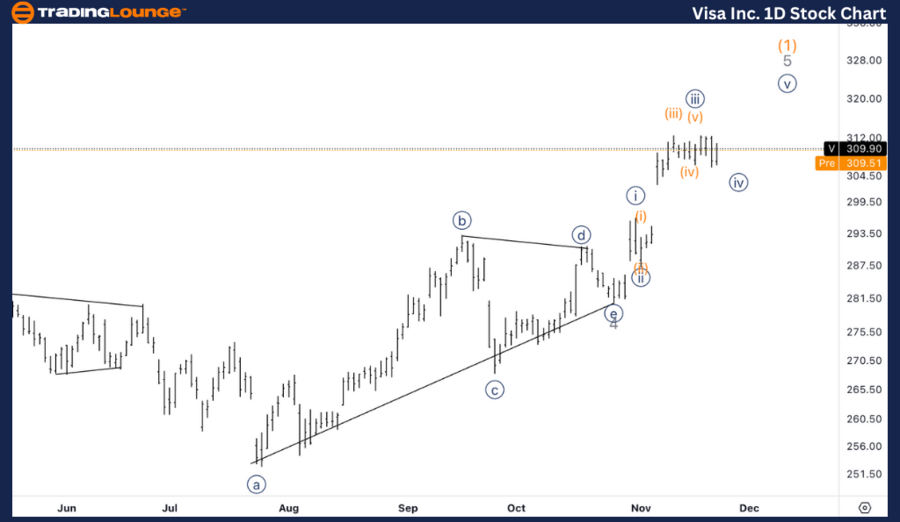
Visa Inc. V Elliott Wave Analysis: TradingLounge Daily Chart

Visa Inc. (V) Daily Chart Analysis

Visa Inc. (V) Elliott Wave Technical Analysis

Function: Trend

Mode: Impulsive

Structure: Motive

Position: Wave {iv} of 5

Direction: Upside in wave {v} of 5

Details: Visa Inc. is currently in wave {iv} of the larger fifth wave, indicating a phase of consolidation near the MinorGroup1 level around $310. This is a typical corrective wave, and once it concludes, we anticipate an upward move into wave {v}, completing the motive structure.

V Elliott Wave Technical Analysis: Daily Chart Breakdown

Visa is consolidating as part of wave {iv}, hovering near $310, the MinorGroup1 level. This phase suggests a corrective pattern before progressing to the final wave {v}. Key confirmation of this move lies in observing how the price behaves during the current consolidation. Upon completion, wave {v} should aim to finalize the fifth wave of this overall motive trend.

Visa-Inc-1D-Stock-Ch...


V Elliott Wave Analysis: TradingLounge 1-Hour Chart

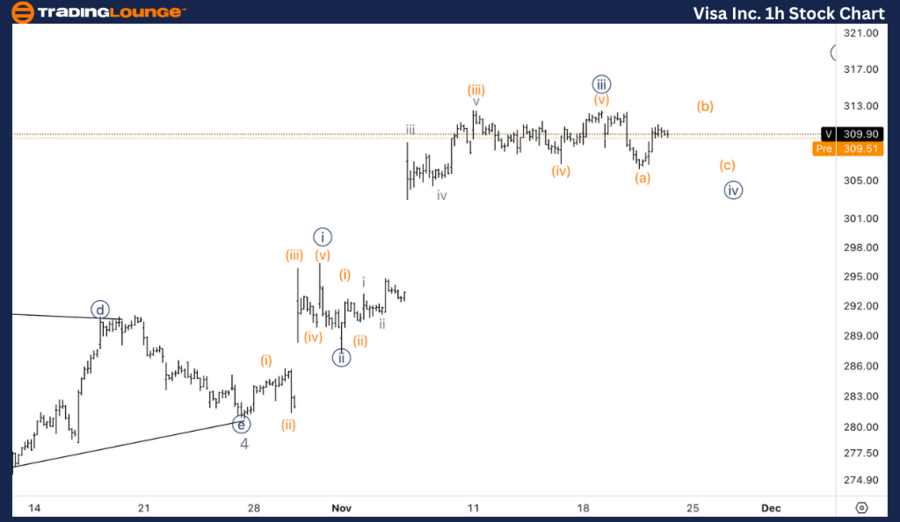
Visa Inc. (V) 1H Chart Analysis

V Technical Analysis

Function: Trend

Mode: Impulsive

Structure: Motive

Position: Wave (a) of {iv}

Direction: Completion in wave {iv}

Details: Visa appears to be in the process of completing wave (a) within wave {iv}, with indications of a three-wave structure in this segment. A potential pullback into wave (b) is expected, followed by a downward move into wave (c) to conclude wave {iv}. Alternatively, there is a chance that wave {iv} has already concluded, as the price is aligning with the previous wave (iv) area. This increases the probability of an impending wave {v} initiation.

V Elliott Wave Technical Analysis: 1-Hour Chart Breakdown

The 1-hour chart analysis shows Visa completing wave (a) of corrective wave {iv}, characterized by a potential three-wave move. The likelihood of a pullback in wave (b) is significant, which would set the stage for a decline into wave (c). However, if wave {iv} has already been completed, the next phase could see the start of wave {v}, pushing the price higher.

Technical Analyst: Alessio Barretta

Source: visit Tradinglounge.com and learn From the Experts Join TradingLounge Here 

See Previous: Deere & Co. (DE) Elliott Wave Technical Analysis

VALUE Offer - Buy 1 Month & Get 3 Months!Click here

Access 7 Analysts Over 200 Markets Covered. Chat Room With Support

Visa-Inc-1h-Stock-Ch...

Related

Exxon Mobil Inc.(XOM) Stocks Elliott Wave Technical Analysis: Provides Traders with detailed insights

Exxon Mobil Inc.(XOM) Stocks Elliott Wave Technical Analysis: Provides Traders with detailed insights

Our latest Elliott Wave analysis for Exxon Mobil Inc. (XOM) provides traders with detailed insights ...

Read More >
NIFTY 50 INDEX Elliott Wave Technical Analysis: Indian Stock Market Outlook Progressing Toward the 25,000-25,100 Range

NIFTY 50 INDEX Elliott Wave Technical Analysis: Indian Stock Market Outlook Progressing Toward the 25,000-25,100 Range

The NIFTY 50 Index is currently in a corrective wave pattern, progressing toward the 25,000-25,100 r...

Read More >
DOTUSD Elliott Wave Analysis: Polkadot Crypto Price Predictions, Technical Indicators, and Enhance Your Trading Strategy

DOTUSD Elliott Wave Analysis: Polkadot Crypto Price Predictions, Technical Indicators, and Enhance Your Trading Strategy

This article provides a detailed Elliott Wave analysis of DOT/USD, offering insights into Polkadot’...

Read More >
Shanghai Composite Index Elliott Wave Technical Analysis - SSE Investment Insights and Shanghai Composite trading

Shanghai Composite Index Elliott Wave Technical Analysis - SSE Investment Insights and Shanghai Composite trading

Gain a deep understanding of Shanghai Composite trading with expert Elliott Wave analysis and action...

Read More >
IBEX 35 (Spain) Index Elliott Wave Technical Analysis: Reveals key insights into the current market trends

IBEX 35 (Spain) Index Elliott Wave Technical Analysis: Reveals key insights into the current market trends

The IBEX 35's Elliott Wave analysis reveals key insights into the current market trends. On the ...

Read More >
Gain expert insights into Binance Crypto Price BNBUSD Elliott Wave Technical Analysis

Gain expert insights into Binance Crypto Price BNBUSD Elliott Wave Technical Analysis

Gain expert insights into Binance Coin (BNBUSD) with our detailed Elliott Wave Analysis. Understand ...

Read More >

Buy 1 Month

Get 3 Months!

Special Offer:

Trade Recommendations

Unleash the power of deversified trading with our comprehensive portfolio, covering:

  • Stock Trades
  • Crypto Trades
  • Forex Trades
  • Commodity Trades
Elliott Wave Analysis

Gain a competive edge with expert insights in to:

  • Global Indices
  • US Stocks & ASX Stocks
  • Forex & Crypto
  • Commodities
Top-Notch Trading Tools

Equip yourself with the tools of success:

  • Social Chat
  • Elliott Wave Algorithm
  • Screener
  • TradingLevels
  • Trading Game
7 Elliott Wave Analysts

Stay ahead of the market with daily charts and insightful videos
-Your secret to strategic trading!

JOIN HERE


Welcome to TradingLounge (ASIC A.R.No. 321187), specialists in trades, trading education and technical analysis, covering stocks, indices, commodities, forex and cryptocurrencies.

When you join TradingLounge you have access to everything we offer, including trade tools, educational content and a social platform to chat with like-minded investors.

Read more

@Copyright 2024 by tradinglounge.com

Contact Us

Australian no: 02 4787 6020

International no: +61 (2) 47876020

Pay with:

Find us on