07Jan

COAL INDIA LTD. Stock Analysis: Elliott Wave Patterns, Price Predictions, and Trading Strategies for Informed Investments

COAL INDIA LTD – COALINDIA (1D Chart) Elliott Wave Technical Analysis

COALINDIA Elliott Wave Technical Analysis

Function: Counter Trend Lower (Minor Degree, Grey)

Mode: Corrective

Structure: Potential Flat

Position: A-B-C Flat Might Be Complete

Details:
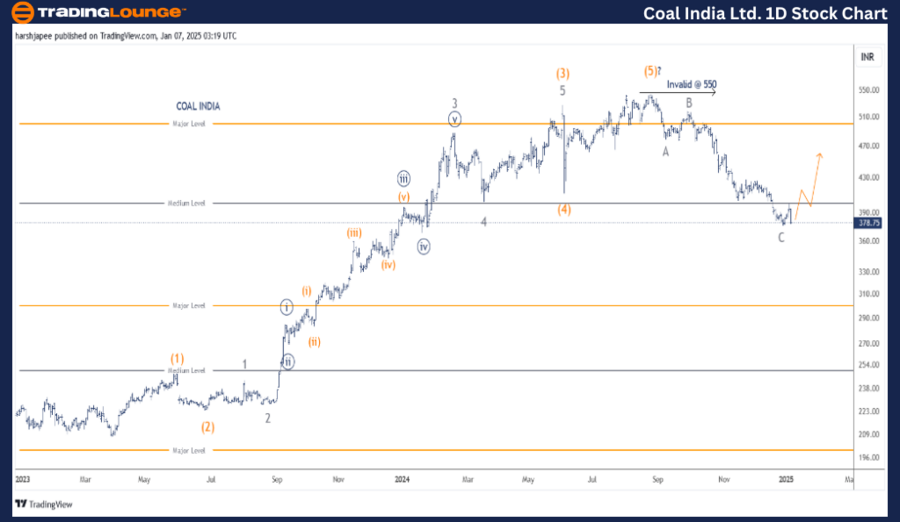
A potential top has formed around the 550 level, marking the termination of Intermediate Wave (5) in Orange. The stock has declined to approximately 375 in three waves (A-B-C). A short-term rally is anticipated from current levels before the next leg of the downward trend resumes.

Invalidation Point: 550

COAL INDIA Daily Chart Technical Analysis and Potential Elliott Wave Counts

The COAL INDIA daily chart signals a major top at the 550 mark. The stock surged from 208 in March 2023 to 550 in August 2024 as an impulse wave, marking the completion of Intermediate Wave (5) in Orange.

Since reaching 550, the price has reversed sharply, dropping to 375 in an A-B-C flat corrective structure. Based on this analysis, a corrective rally towards at least 430 levels is likely before the next leg of the downtrend continues.

COAL-INDIA-LTD-1d-st...


COAL INDIA LTD – COALINDIA (4H Chart) Elliott Wave Technical Analysis

Function: Counter Trend Lower (Minor Degree, Grey)

Mode: Corrective

Structure: Potential Flat

Position: A-B-C Flat Might Be Complete

Details:
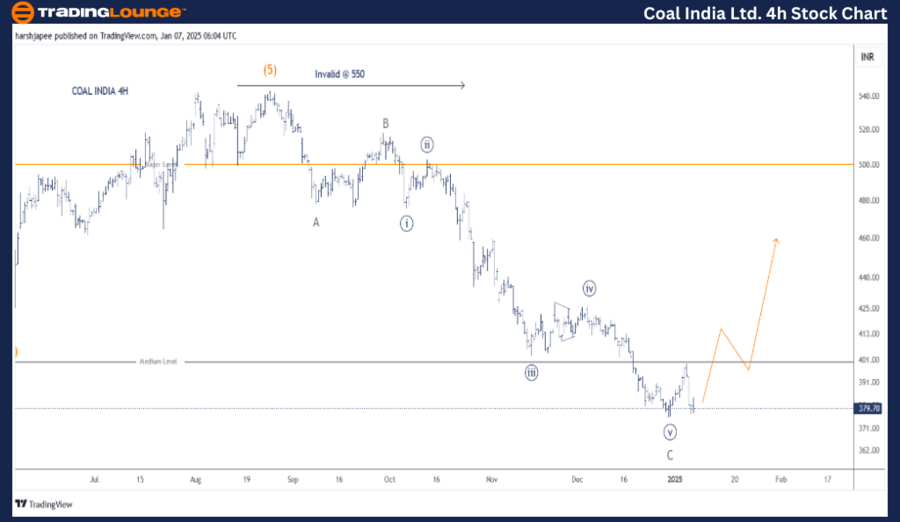
A potential top is visible at the 550 level, marking the end of Intermediate Wave (5) in Orange. From this level, the stock has dropped to the 375 mark, forming an A-B-C corrective flat. Minor Wave C subdivides into five smaller waves, suggesting the possibility of a short-term rally before the downward movement resumes.

Invalidation Point: 550

COAL INDIA 4H Chart Technical Analysis and Potential Elliott Wave Counts

The COAL INDIA 4H chart illustrates a wave structure since the 550 high. The pattern resembles an A-B-C (3-3-5) flat correction, complete at the 375 level. If correct, buyers might re-enter soon, driving a short-term rally.

Alternatively, if the decline continues, the current structure could extend or evolve into an impulse wave from the 550 high. Nevertheless, a pullback rally is anticipated before further downside moves materialize.

Technical Analyst: Harsh Japee

Source: visit Tradinglounge.com and learn From the Experts Join TradingLounge Here 

Previous: ADANI ENTERPRISES LTD. Elliott Wave Technical Analysis

VALUE Offer - Buy 1 Month & Get 3 Months!Click here

Access 7 Analysts Over 200 Markets Covered. Chat Room With Support

COAL-INDIA-LTD-4h-st...


Conclusion

COAL INDIA appears set for a corrective pullback from the 375 low, having completed a Minor Degree A-B-C flat correction from the 550 high. Traders should monitor for a potential rally before the next downward leg resumes.

Related

Examines NTPC's Recent Price Trends, Support and Resistance Levels: NTPC Stocks Elliott Wave Technical Analysis

Examines NTPC's Recent Price Trends, Support and Resistance Levels: NTPC Stocks Elliott Wave Technical Analysis

This article provides a comprehensive Elliott Wave analysis of NTPC stock, highlighting key price ta...

Read More >
USDCHF Elliott Wave Technical Analysis Highlighting Navy Blue Wave 2, Orange Wave C, Critical Levels, and Market Dynamics for Traders

USDCHF Elliott Wave Technical Analysis Highlighting Navy Blue Wave 2, Orange Wave C, Critical Levels, and Market Dynamics for Traders

This comprehensive analysis of USDCHF highlights Elliott Wave structures, focusing on Navy Blue Wave...

Read More >
Euro/ U.S. Dollar (EURUSD) Elliott Wave Analysis: Market Trends, and Trading Strategy for Forex Traders Using Elliott Wave Theory

Euro/ U.S. Dollar (EURUSD) Elliott Wave Analysis: Market Trends, and Trading Strategy for Forex Traders Using Elliott Wave Theory

EURUSD Elliott Wave Analysis provides a detailed forecast of the Euro/USD currency pair, highlightin...

Read More >
ASX Stock Trading Success: TRANSURBAN GROUP (TCL) Stock Forecast & TCL Elliott Wave Technical Analysis

ASX Stock Trading Success: TRANSURBAN GROUP (TCL) Stock Forecast & TCL Elliott Wave Technical Analysis

Explore the comprehensive Elliott Wave analysis of ASX TRANSURBAN GROUP (TCL). This analysis covers ...

Read More >
Fortinet Inc. (FTNT) Stocks Elliott Wave Technical Analysis: Covering Daily Chart and 1-hour Chart, Indicating a Bullish Trend

Fortinet Inc. (FTNT) Stocks Elliott Wave Technical Analysis: Covering Daily Chart and 1-hour Chart, Indicating a Bullish Trend

This article provides a detailed Elliott Wave analysis of Fortinet Inc. (FTNT), covering daily and 1...

Read More >
Australian Dollar / Japanese Yen (AUDJPY) Elliott Wave Analysis: Bearish Trend, Price Prediction, and Forex Trading Strategy

Australian Dollar / Japanese Yen (AUDJPY) Elliott Wave Analysis: Bearish Trend, Price Prediction, and Forex Trading Strategy

AUDJPY Elliott Wave analysis provides a detailed technical outlook on the current forex market trend...

Read More >

$1 for 2 Weeks

then $29 a month!

What a Special Offer!

Trade Recommendations

Unleash the power of deversified trading with our comprehensive portfolio, covering 250+ markets:

  • Stock Trades
  • Crypto Trades
  • Forex Trades
  • Commodity Trades
Elliott Wave Analysis

Gain a competitive edge with expert insights and AI-powered Elliott Wave charting into:

  • Global Indices
  • US Stocks & ASX Stocks
  • Forex & Crypto
  • Commodities
Top-Notch Trading Tools

Equip yourself with the tools of success:

  • Real-time Chat rooms
  • Elliott Wave Algorithm
  • Portfolio tools
  • TradingLevels
  • Screener
  • Trading Game
7 Elliott Wave Analysts

Stay ahead of the market with daily charts and insightful videos
Your secret to strategic trading!

JOIN HERE


Welcome to TradingLounge (ASIC A.R.No. 321187), specialists in trades, trading education and technical analysis, covering stocks, indices, commodities, forex and cryptocurrencies.

When you join TradingLounge you have access to everything we offer, including trade tools, educational content and a social platform to chat with like-minded investors.

Read more

@Copyright 2024 by tradinglounge.com

Contact Us

Australian no: 02 4787 6020

International no: +61 (2) 47876020

Pay with:

Find us on