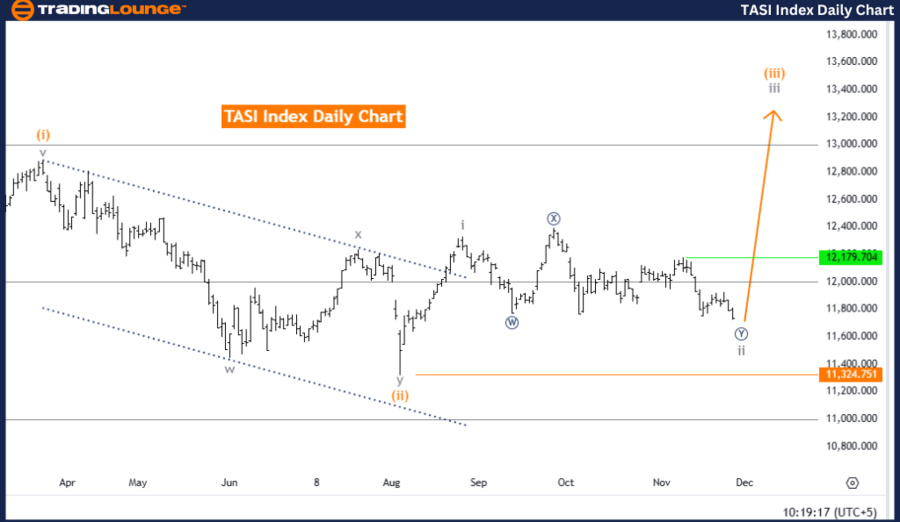
TASI Index Elliott Wave Analysis – TradigLounge Daily Chart
TASI Index Elliott Wave Technical Analysis
Function: Counter Trend
Mode: Corrective
Structure: Gray Wave 2
Position: Orange Wave 3
Direction (Next Higher Degree): Gray Wave 3
Details: Gray wave 1 is completed, while gray wave 2 is still active and nearing completion.
Wave Cancel Invalidation Level: 11324.751
TASI Index Analysis Summary
This daily Elliott Wave analysis of the TASI Index highlights its current position in a counter-trend corrective phase, a temporary reversal in the broader trend.
Key Observations:
-
Primary Structure:
- The focus is on gray wave 2, which followed the completion of gray wave 1.
- The corrective phase is expected to conclude soon.
-
Current Position:
- The index is progressing through orange wave 3, part of the broader gray wave 2 structure.
- This phase reflects the continuation of the counter-trend movement.
-
Next Phase:
- Once gray wave 2 concludes, the index will transition into gray wave 3, resuming the higher-degree impulsive trend.
-
Invalidation Level:
- The invalidation point is set at 11324.751. A decline to this level would negate the current wave count and corrective outlook.
- This level is critical for both risk management and confirmation of the trend.
Conclusion
The TASI Index is in a counter-trend corrective phase with gray wave 2 nearing completion. Gray wave 1's conclusion initiated this phase, and orange wave 3 currently drives its progression.
As long as the index remains above the invalidation level of 11324.751, the counter-trend scenario remains valid. The analysis anticipates the corrective phase to conclude soon, transitioning the index into the impulsive gray wave 3 phase.
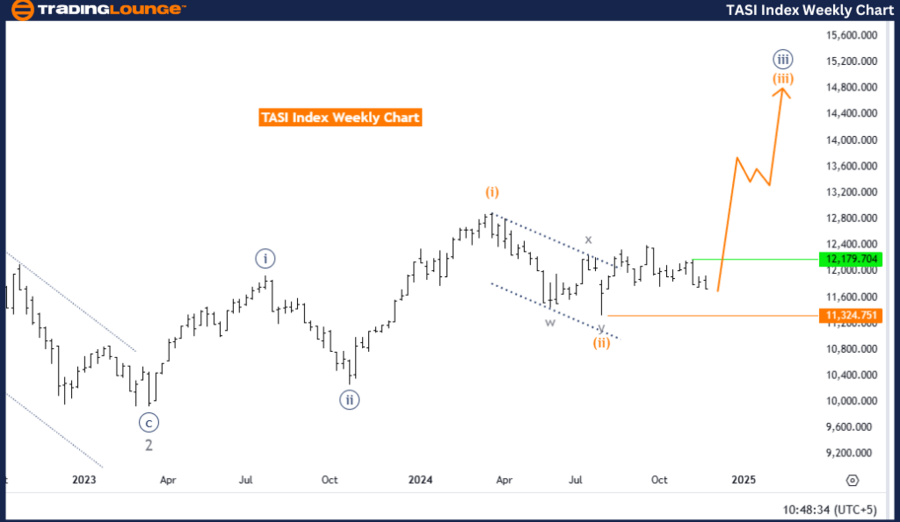
TASI Index Elliott Wave Analysis – Weekly Chart
TASI Index Elliott Wave Technical Analysis
Function: Bullish Trend
Mode: Impulsive
Structure: Orange Wave 3
Position: Navy Blue Wave 3
Direction (Next Higher Degree): Continuation of Orange Wave 3
Details: Orange wave 2 is completed, and orange wave 3 is currently active.
Wave Cancel Invalidation Level: 11324.751
TASI Index Analysis Summary
This weekly Elliott Wave analysis of the TASI Index identifies a bullish trend driven by strong upward momentum, as the market progresses within an impulsive mode.
Key Observations:
-
Primary Structure:
- The analysis centers on orange wave 3, initiated after orange wave 2's completion.
- This wave signals the continuation of the bullish trend within the Elliott Wave structure.
-
Current Position:
- The index is advancing in navy blue wave 3, part of the broader orange wave 3 structure.
- This phase reflects the active upward progression of the trend.
-
Next Phase:
- Orange wave 3 is expected to sustain the bullish trend, driving the index to higher levels with continued momentum.
-
Invalidation Level:
- An invalidation point is set at 11324.751. A decline to this level would invalidate the current wave count and bullish outlook.
- This benchmark aids in effective risk management and trend confirmation.
Conclusion
The TASI Index is in a bullish trend phase, actively driven by orange wave 3, with navy blue wave 3 leading the upward progression. Following the completion of orange wave 2, the index exhibits strong momentum, maintaining its bullish trajectory.
The bullish outlook remains intact as long as the index stays above the invalidation level of 11324.751. The analysis foresees continued upward movement as orange wave 3 progresses within the impulsive phase.
Technical Analyst: Malik Awais
Source: visit Tradinglounge.com and learn From the Experts Join TradingLounge Here
Previous: Hang Seng Index Elliott Wave Technical Analysis
VALUE Offer - Buy 1 Month & Get 3 Months!Click here
Access 7 Analysts Over 200 Markets Covered. Chat Room With Support