12Jul

Avery Dennison Corp. (AVY) Elliott Wave Analysis Predicts Bullish Wave 3 Breakout with Strong Technical Chart Setup for Traders

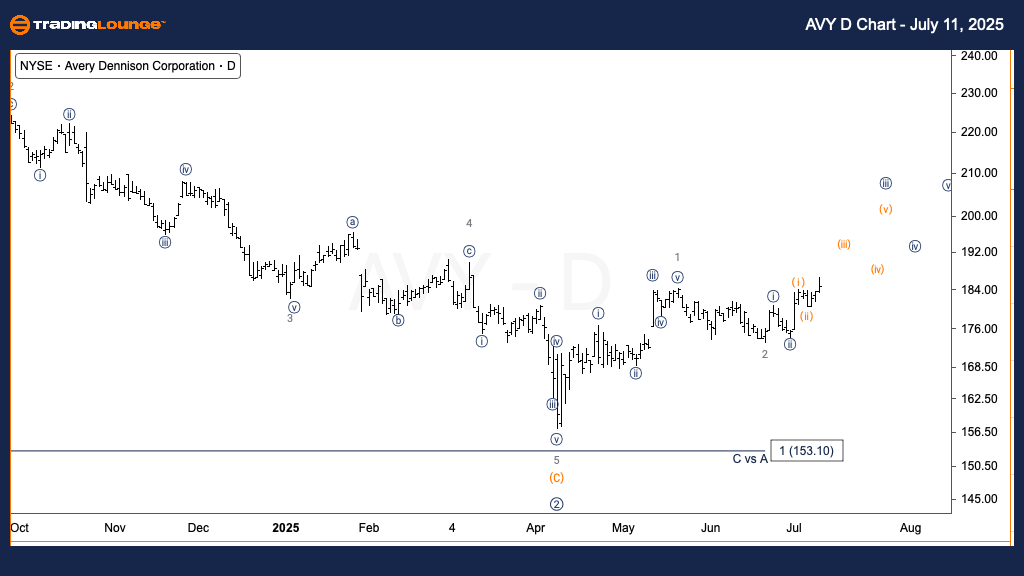
Avery Dennison Corp. (AVY) – Elliott Wave Analysis | Trading Lounge Daily Chart

AVY Daily Chart Analysis – Technical Overview

Function: Trend

Mode: Motive

Structure: Impulsive

Position: Wave 3 of (1)

Direction: Upside into wave 3

Details: The stock has breached the prior downtrend from wave (C), signaling a potential breakout into wave 3.

The daily Elliott Wave chart of Avery Dennison Corp. (AVY) indicates a possible initiation of a strong upward impulsive wave sequence. It appears that the corrective phase—wave (C)—has ended, with the stock price surpassing the declining trendline. This move strengthens the case for entry into wave 3 of (1), a segment traditionally associated with accelerated price action. Given wave 3’s typical strength in Elliott Wave structures, this setup suggests a bullish medium-term forecast for AVY.

AVY-d-us-stock-chart...


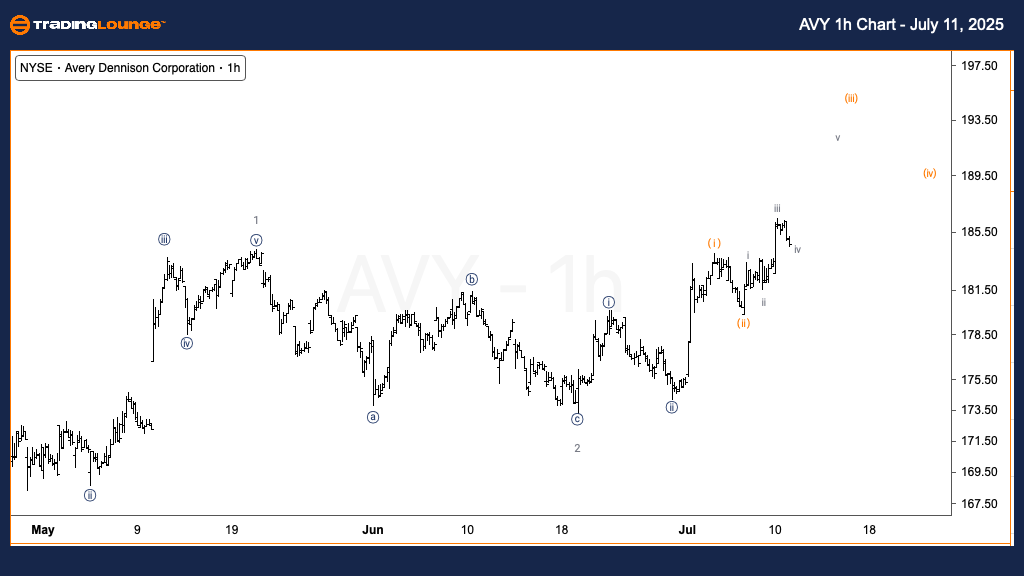
Avery Dennison Corp. (AVY) – Elliott Wave Analysis | Trading Lounge 1-Hour Chart

AVY 1-Hour Chart Analysis – Technical Overview

Function: Trend

Mode: Motive

Structure: Impulsive

Position: Wave (iii) of {iii}

Direction: Upside in wave (iii)

Details: The move likely continues within wave (iii) of {iii}, though a top in wave (v) of {i} could hint at a corrective wave {ii} ahead.

The 1-hour Elliott Wave analysis of AVY highlights sustained bullish momentum, with the price action aligning with wave (iii) of {iii}. This formation supports the ongoing strength in the stock’s impulsive pattern. However, an alternate wave count implies the advance could be nearing a top at wave (v) of {i}, which might lead to a larger corrective pullback in wave {ii}. Investors and traders should remain alert for either continued bullish validation or early signals of a corrective phase developing.

Technical Analyst: Alessio Barretta

Visit: TradingLounge.com for detailed analysis and market updates.

Previous: The Boeing Company (BA) Elliott Wave Technical Analysis

VALUE Offer - $1 for 2 Weeks then $29 a month!Click here

Access 7 Analysts Over 200 Markets Covered. Chat Room With Support

AVY-1h-us-stock-char...

Related

Australian Dollar/Japanese Yen(AUDJPY) Elliott Wave Technical Analysis 31 January 24

Australian Dollar/Japanese Yen(AUDJPY) Elliott Wave Technical Analysis 31 January 24

Trading Lounge Day and 4-hour Chart AUDJPY Elliott Wave Analysis dated 31 January 24, provides a det...

Read More >
British Pound/U.S. Dollar Forex Pair Market Analysis and Detailed Insight on GBPUSD Elliott Wave Technical Analysis

British Pound/U.S. Dollar Forex Pair Market Analysis and Detailed Insight on GBPUSD Elliott Wave Technical Analysis

The GBPUSD Elliott Wave analysis for both the day and 4-hour charts indicates a strong bullish trend...

Read More >
Explore Hang Seng ETFs, Index Funds, and more to Enhance your Trading Portfolio: Hang Seng Index Elliott Wave Technical Analysis

Explore Hang Seng ETFs, Index Funds, and more to Enhance your Trading Portfolio: Hang Seng Index Elliott Wave Technical Analysis

Unlock the potential of Hang Seng trading with our in-depth guide. From Elliott Wave analysis and HS...

Read More >
NEOUSD Elliott Wave Technical Analysis: Price Prediction & Crypto market Analysis Enhance your Trading with our expert insights.

NEOUSD Elliott Wave Technical Analysis: Price Prediction & Crypto market Analysis Enhance your Trading with our expert insights.

This article provides an in-depth analysis of NEOUSD using the Elliott Wave theory. It includes accu...

Read More >
Polkadot (DOTUSD) Elliott Wave Analysis & Trading Strategy - February 5, 24

Polkadot (DOTUSD) Elliott Wave Analysis & Trading Strategy - February 5, 24

Delve into Polkadot's (DOTUSD) market dynamics with expert Elliott Wave analysis and strategic i...

Read More >
Elliott Wave Technical Analysis for AbbVie Stock: Forecast, Price Prediction, and Trading Opportunities

Elliott Wave Technical Analysis for AbbVie Stock: Forecast, Price Prediction, and Trading Opportunities

This detailed AbbVie stock analysis applies Elliott Wave theory to assess the stock's current pr...

Read More >

$1 for 2 Weeks

then $29 a month!

What a Special Offer!

Trade Recommendations

Unleash the power of deversified trading with our comprehensive portfolio, covering 250+ markets:

  • Stock Trades
  • Crypto Trades
  • Forex Trades
  • Commodity Trades
Elliott Wave Analysis

Gain a competitive edge with expert insights and AI-powered Elliott Wave charting into:

  • Global Indices
  • US Stocks & ASX Stocks
  • Forex & Crypto
  • Commodities
Top-Notch Trading Tools

Equip yourself with the tools of success:

  • Real-time Chat rooms
  • Elliott Wave Algorithm
  • Portfolio tools
  • TradingLevels
  • Screener
  • Trading Game
7 Elliott Wave Analysts

Stay ahead of the market with daily charts and insightful videos
Your secret to strategic trading!

JOIN HERE


Welcome to TradingLounge (ASIC A.R.No. 321187), specialists in trades, trading education and technical analysis, covering stocks, indices, commodities, forex and cryptocurrencies.

When you join TradingLounge you have access to everything we offer, including trade tools, educational content and a social platform to chat with like-minded investors.

Read more

@Copyright 2024 by tradinglounge.com

Contact Us

Australian no: 02 4787 6020

International no: +61 (2) 47876020

Pay with:

Find us on