24Feb

BPCL Indian Stocks Elliott Wave Technical Analysis - BPCL Share Price, Helping Traders and Investors Make Informed Decisions

BPCL – BPCL (1D Chart) Elliott Wave Technical Analysis

BPCL 1D Chart Analysis

BPCL Elliott Wave Technical Analysis

Function: Counter-Trend (Intermediate Degree Orange)

Mode: Corrective

Structure: Potential Impulse within a Larger Degree Correction

Position: Minute Wave ((v))

Details:

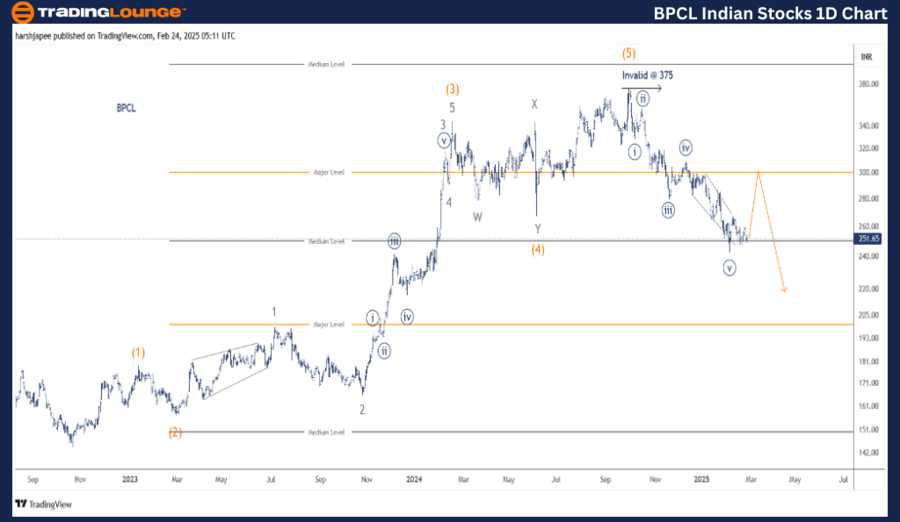
  • The lower-degree impulse wave appears complete around 243.
  • Minute Wave ((v)) has developed as a diagonal formation.
  • If accurate, a counter-trend rally could drive prices above the 300 level soon.

Invalidation Point: 375


BPCL Daily Chart – Technical Analysis & Elliott Wave Counts

The BPCL daily chart suggests a trend reversal following the stock’s decline from 375 in October 2024.

  • A potential impulse lower appears to be completed, indicating a broader downtrend against the all-time high of 375.
  • Previously, BPCL found support within the 140-145 zone (October 2022).
  • Following this, an Intermediate Degree five-wave rally (Waves (1) through (5)) drove the stock to a peak of 375 in October 2024.
  • Since then, bearish momentum has dominated, signaling the onset of a larger correction.

BPCL-Indian-Stocks-1...


BPCL – BPCL (4H Chart) Elliott Wave Technical Analysis

BPCL Elliott Wave Technical Analysis

Function: Counter-Trend (Intermediate Degree Orange)

Mode: Corrective

Structure: Potential Impulse within a Larger Degree Correction

Position: Minute Wave ((v))

Details:

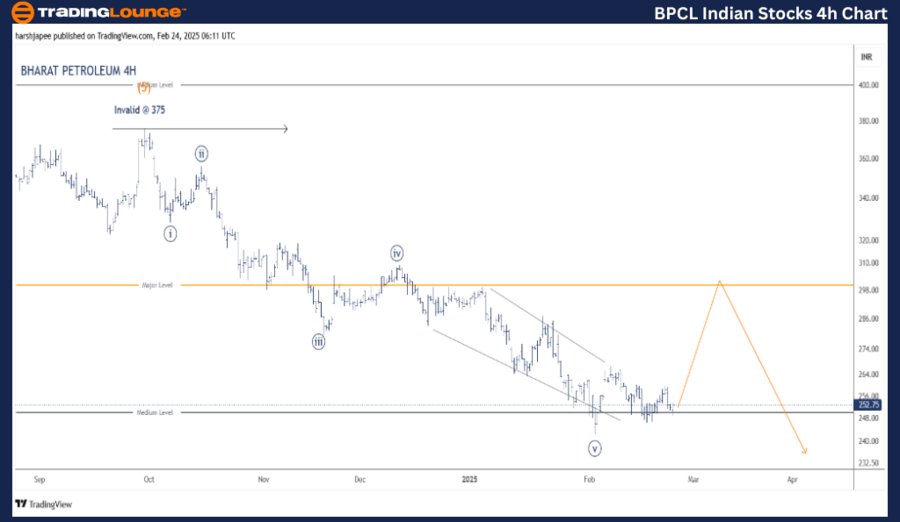
  • The lower-degree impulse wave appears to have concluded around 243.
  • Minute Wave ((v)) likely formed as an ending diagonal.
  • If this count holds, a corrective rally above 300 is expected before a deeper downturn.

Invalidation Point: 375


BPCL 4H Chart – Technical Analysis & Elliott Wave Counts

The BPCL 4H chart breaks down sub-waves following the stock’s 375 peak in October 2024.

  • The drop from 375 to 243 resembles an impulse wave at the Minute Degree.
  • Minute Wave ((v)) may have completed as an ending diagonal, hinting at a temporary corrective rally.
  • If the structure is valid, BPCL could see a retracement toward 306 before bearish pressure resumes.
  • A deeper correction toward 144 may unfold in the coming months.

Technical Analyst: Harsh Japee

Source: visit Tradinglounge.com and learn From the Experts Join TradingLounge Here 

Previous:ADANI POWER Elliott Wave Technical Analysis

VALUE Offer - Buy 1 Month & Get 3 Months!Click here

Access 7 Analysts Over 200 Markets Covered. Chat Room With Support

BPCL-Indian-Stocks-4...


Conclusion

BPCL remains in a downtrend below 375, and after a potential corrective rally, a deeper correction could follow.

Key Resistance Levels:

  • 300-310 range – Potential selling pressure may emerge in this zone.

Related

New Zealand Dollar/U.S. Dollar (NZDUSD) Elliott Wave Technical Analysis: 4-Hour & Daily Chart Overview, February 13, 2024

New Zealand Dollar/U.S. Dollar (NZDUSD) Elliott Wave Technical Analysis: 4-Hour & Daily Chart Overview, February 13, 2024

Expert insights into NZDUSD analysis and forecasts, covering the New Zealand Dollar/U.S. Dollar curr...

Read More >
Gain expert insights into Dogecoin's market Crypto Price: DOGEUSD Elliott Wave Technical Analysis

Gain expert insights into Dogecoin's market Crypto Price: DOGEUSD Elliott Wave Technical Analysis

trends with our comprehensive Elliott Wave analysis. Learn about DOGEUSD technical analysis, trading...

Read More >
Understanding these trends and corrections: Soybean Elliott Wave Technical Analysis

Understanding these trends and corrections: Soybean Elliott Wave Technical Analysis

The Elliott wave Technical analysis of Soybean suggests a corrective bounce within the broader conte...

Read More >
Swiss Market Index Elliott Wave Technical Analysis: Key Insights for Daily and Weekly Chart Trends

Swiss Market Index Elliott Wave Technical Analysis: Key Insights for Daily and Weekly Chart Trends

The Swiss Market Index (SMI) Elliott Wave Analysis provides a detailed look at current market trends...

Read More >
Soybeans Elliott Wave Technical Analysis: Assessing Current Impulse and Future Trends

Soybeans Elliott Wave Technical Analysis: Assessing Current Impulse and Future Trends

This article provides an in-depth Elliott Wave analysis of the soybean market. It covers the ongoing...

Read More >

$1 for 2 Weeks

then $29 a month!

What a Special Offer!

Trade Recommendations

Unleash the power of deversified trading with our comprehensive portfolio, covering 250+ markets:

  • Stock Trades
  • Crypto Trades
  • Forex Trades
  • Commodity Trades
Elliott Wave Analysis

Gain a competitive edge with expert insights and AI-powered Elliott Wave charting into:

  • Global Indices
  • US Stocks & ASX Stocks
  • Forex & Crypto
  • Commodities
Top-Notch Trading Tools

Equip yourself with the tools of success:

  • Real-time Chat rooms
  • Elliott Wave Algorithm
  • Portfolio tools
  • TradingLevels
  • Screener
  • Trading Game
7 Elliott Wave Analysts

Stay ahead of the market with daily charts and insightful videos
Your secret to strategic trading!

JOIN HERE


Welcome to TradingLounge (ASIC A.R.No. 321187), specialists in trades, trading education and technical analysis, covering stocks, indices, commodities, forex and cryptocurrencies.

When you join TradingLounge you have access to everything we offer, including trade tools, educational content and a social platform to chat with like-minded investors.

Read more

@Copyright 2024 by tradinglounge.com

Contact Us

Australian no: 02 4787 6020

International no: +61 (2) 47876020

Pay with:

Find us on