21Feb

Adani Power Elliott Wave Technical Analysis: Stock Forecast, Support & Resistance Levels, and Market Movement Insights

ADANI POWER – ADANIPOWER Elliott Wave Technical Analysis (1D Chart)

ADANIPOWER Elliott Wave Technical Analysis

Function: Counter Trend (Intermediate Degree, Orange)

Mode: Corrective

Structure: Potential Impulse within Larger Degree Zigzag

Position: Minute Wave ((iv)) Navy

Details:

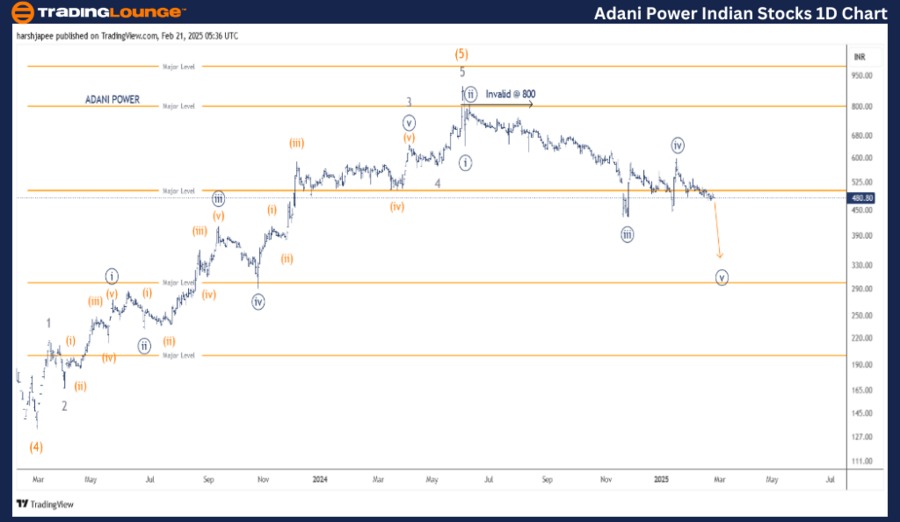
  • Minute Wave ((iv)) Navy appears to have completed near the 600 level within Minor Wave 1, facing resistance at 800.
  • If this wave structure is correct, Minute Wave ((v)) is now unfolding.
  • Invalidation Point: 800

ADANI POWER – Daily Chart Technical Analysis & Elliott Wave Counts

The ADANI POWER daily chart suggests that a significant top was formed at 900 in Intermediate Wave (5) Orange around June 2024.

  • A downward impulse wave is currently in progress at Minute Degree, pushing prices lower towards 300 as bearish pressure sustains below 800 resistance.
  • The stock previously declined to 130 in February 2023, marking the completion of Intermediate Wave (4) Orange.
  • A Minor Degree impulse wave (Waves 1 through 5) then pushed prices up to 900, followed by a sharp reversal.
  • Currently, the stock is in a downward trajectory, nearing its first impulse termination at Minor Degree.

ADANIPOWER-1d-stock-...


ADANI POWER – ADANIPOWER Elliott Wave Technical Analysis (4H Chart)

ADANIPOWER Elliott Wave Technical Analysis

Function: Counter Trend (Intermediate Degree, Orange)

Mode: Corrective

Structure: Potential Impulse within Larger Degree Zigzag

Position: Minute Wave ((iv)) Navy

Details:

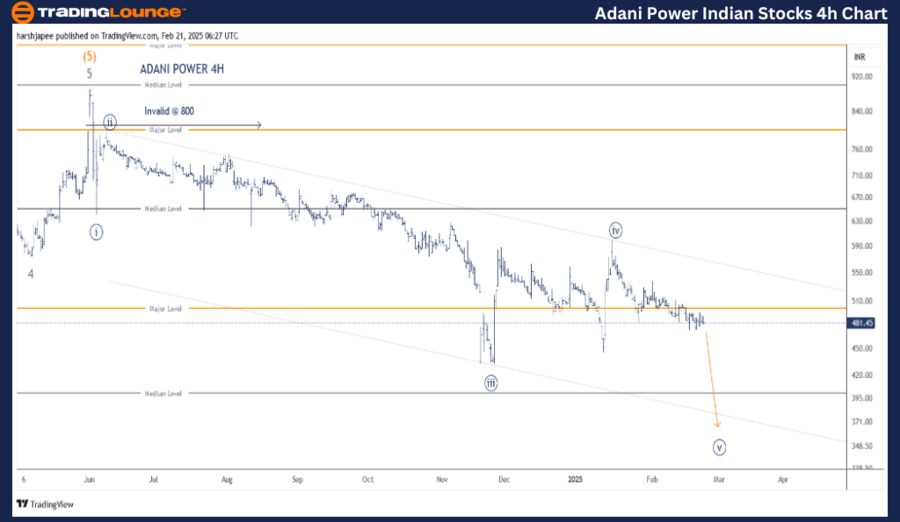
  • Minute Wave ((iv)) Navy might have completed around 600, within Minor Wave 1, facing 800 resistance.
  • If the wave count remains intact, Minute Wave ((v)) is now in progress, with a potential target at 306.
  • Invalidation Point: 800

ADANI POWER – 4H Chart Technical Analysis & Elliott Wave Counts

The ADANI POWER 4H chart showcases sub-waves following the Intermediate Wave (5) Orange completion around 900 in June 2024.

  • Minute Waves ((i)) through ((iv)) have formed at 640, 800, 430, and 600 levels, respectively.
  • If the wave count holds, prices are expected to stay below 600 and continue declining towards 306, where Minute Wave ((v)) is anticipated to complete.

Technical Analyst: Harsh Japee

Source: visit Tradinglounge.com and learn From the Experts Join TradingLounge Here 

Previous: BAJAJ FINANCE Elliott Wave Technical Analysis

VALUE Offer - Buy 1 Month & Get 3 Months!Click here

Access 7 Analysts Over 200 Markets Covered. Chat Room With Support

ADANIPOWER-4h-stock-...


Conclusion

ADANI POWER remains in a downtrend, moving towards 306, where Minute Wave ((v)) is expected to terminate.

Related

Coffee Commodity Elliott Wave Technical Analysis: Focusing on the Current Market Trends and Future Predictions

Coffee Commodity Elliott Wave Technical Analysis: Focusing on the Current Market Trends and Future Predictions

This article provides a detailed Elliott Wave Analysis of coffee prices, focusing on the current mar...

Read More >
The Procter & Gamble Company (PG) Elliott Wave Technical Analysis 9 February 24

The Procter & Gamble Company (PG) Elliott Wave Technical Analysis 9 February 24

Delve into the world of trading with a comprehensive analysis of Procter & Gamble (PG) stock using E...

Read More >
S&P BSE Sensex Elliott Wave Analysis – Market Trends, Corrective Phase, and Trading Signals for Daily & Weekly Charts

S&P BSE Sensex Elliott Wave Analysis – Market Trends, Corrective Phase, and Trading Signals for Daily & Weekly Charts

S&P BSE Sensex (India) Index provides insights into the current corrective phase and upcoming bullis...

Read More >
U.S.Dollar/Japanese Yen (USDJPY) Day Chart Elliott Wave Technical Analysis 9 November 23

U.S.Dollar/Japanese Yen (USDJPY) Day Chart Elliott Wave Technical Analysis 9 November 23

U.S.Dollar/Japanese Yen (USDJPY) Day Chart Elliott Wave Technical Analysis 9 November 23 represents ...

Read More >
U.S.Dollar/Canadian Dollar(USD/CAD) Elliott Wave Technical Analysis 24 October 23

U.S.Dollar/Canadian Dollar(USD/CAD) Elliott Wave Technical Analysis 24 October 23

In summary, the USD/CAD Elliott Wave Analysis for 24 October 23, is significant for traders seeking ...

Read More >
XRP Ripple Elliott Wave Analysis:  Market Trends, Support & Resistance Levels, and Technical Forecast for XRPUSD

XRP Ripple Elliott Wave Analysis: Market Trends, Support & Resistance Levels, and Technical Forecast for XRPUSD

XRP Elliott Wave analysis, highlighting the current XRPUSD price movement, key support and resistanc...

Read More >

Buy 1 Month

Get 3 Months!

Special Offer:

Trade Recommendations

Unleash the power of deversified trading with our comprehensive portfolio, covering:

  • Stock Trades
  • Crypto Trades
  • Forex Trades
  • Commodity Trades
Elliott Wave Analysis

Gain a competive edge with expert insights in to:

  • Global Indices
  • US Stocks & ASX Stocks
  • Forex & Crypto
  • Commodities
Top-Notch Trading Tools

Equip yourself with the tools of success:

  • Social Chat
  • Elliott Wave Algorithm
  • Screener
  • TradingLevels
  • Trading Game
7 Elliott Wave Analysts

Stay ahead of the market with daily charts and insightful videos
-Your secret to strategic trading!

JOIN HERE


Welcome to TradingLounge (ASIC A.R.No. 321187), specialists in trades, trading education and technical analysis, covering stocks, indices, commodities, forex and cryptocurrencies.

When you join TradingLounge you have access to everything we offer, including trade tools, educational content and a social platform to chat with like-minded investors.

Read more

@Copyright 2024 by tradinglounge.com

Contact Us

Australian no: 02 4787 6020

International no: +61 (2) 47876020

Pay with:

Find us on