AAVEUSD Elliott Wave Analysis TradingLounge Daily Chart,
In the realm of Elliott Wave Analysis, AAVE/USD presents compelling opportunities for traders, marked by bullish signals and corrective wave patterns. Let's delve into the technical intricacies and potential trading strategies for AAVEUSD across different timeframes.
AAVEUSD Elliott Wave Technical Analysis
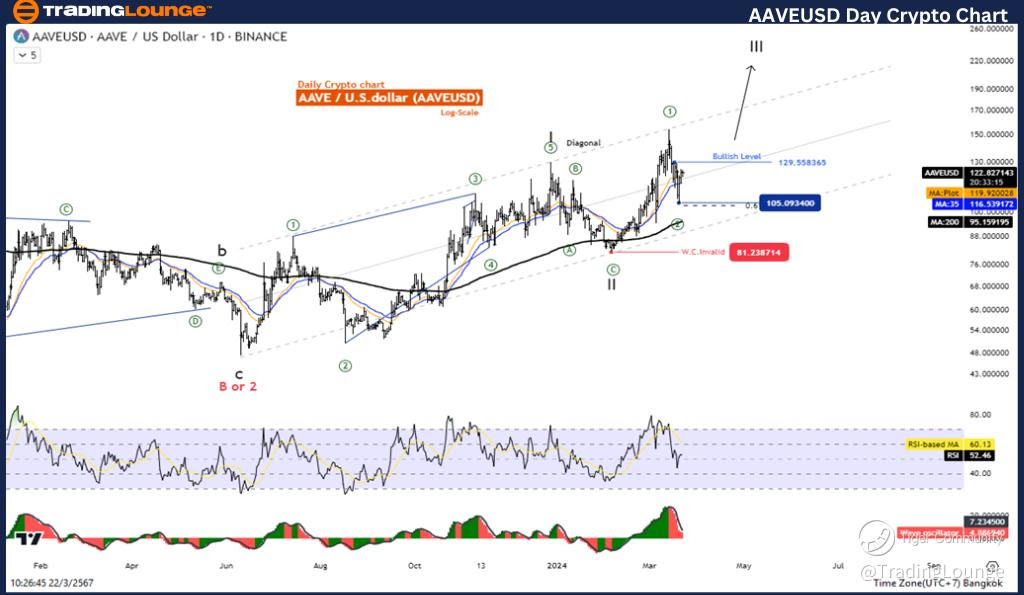
AAVE/ U.S. dollar(AAVEUSD) Daily Chart Analysis:
Function: Counter Trend
Mode: Corrective
Structure: Zigzag
Position: Wave C
Direction Next higher Degrees: Wave ((2)) of Impulse
Wave Cancel invalid Level: 81.238
Detailed: Elliott Wave Analysis suggests that AAVEUSD is currently in a corrective phase, specifically Wave C within a Zigzag structure. Notably, Wave ((2)) of a larger Impulse pattern is underway, with a cancellation level at 81.238. This indicates a potential completion of Wave ((2)), paving the way for an upward movement in Wave ((3)).
Trading Strategy for AAVE/USD:
With the overall uptrend intact and the Impulse pattern entering its third wave, there's a favorable outlook for bullish trading opportunities. As the price recuperates from the second wave correction, anticipation mounts for a resurgence during the third wave. Traders are encouraged to consider bullish positions in alignment with this Elliott Wave projection.
Technical Indicators:
- Price Position: Above MA200, signaling an Uptrend
- Wave Oscillator: Reflects bullish Momentum

AAVEUSD Elliott Wave Analysis TradingLounge 4H Chart,
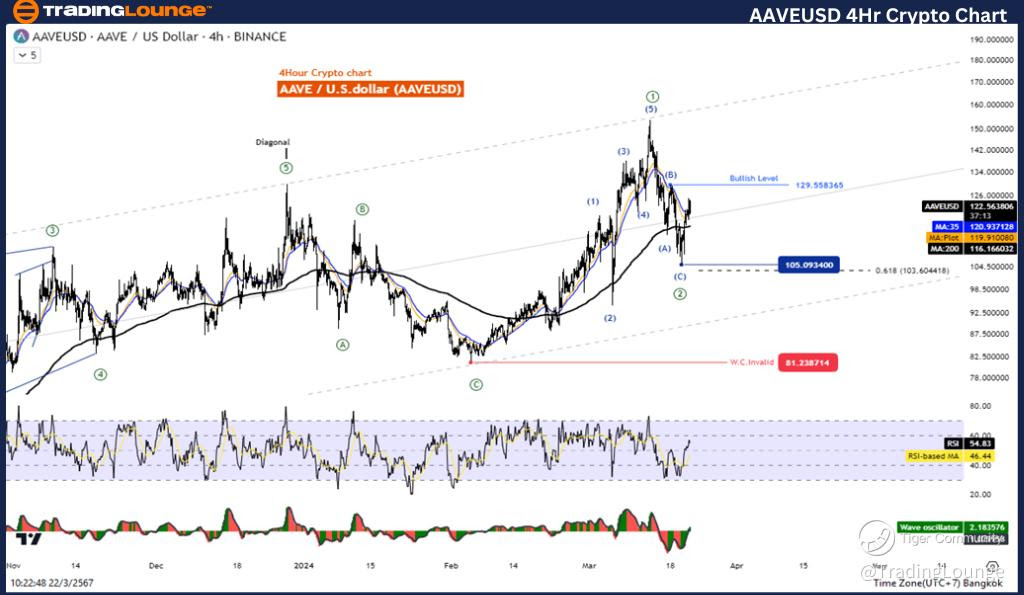
AAVE/ U.S. dollar(AAVEUSD) 4H Chart Analysis
AAVEUSD Elliott Wave Technical Analysis
Function: Counter Trend
Mode: Corrective
Structure: Zigzag
Position: Wave C
Direction Next higher Degrees: Wave ((2)) of Impulse
Wave Cancel invalid Level: 81.238
Similar to the daily chart, the 4-hour timeframe for AAVEUSD reveals a corrective Zigzag pattern with Wave C in progress. This corroborates the Elliott Wave Analysis on the daily chart, reinforcing the potential completion of Wave ((2)) and the subsequent upward trajectory in Wave ((3)).
Trading Strategy for AAVE/USD (4H):
Aligning with the overarching uptrend and the imminent third wave of the Impulse pattern, traders can capitalize on short-term recoveries from the second wave correction. Bullish trading strategies remain favorable as the price is anticipated to ascend further.
Technical Indicators (4H):
- Price Position: Above MA200, affirming the Uptrend
- Wave Oscillator: Indicates bullish Momentum
In conclusion, AAVE/USD presents promising opportunities for traders, guided by Elliott Wave Analysis and supported by bullish signals across various timeframes. As the corrective phase unfolds and Wave ((3)) looms on the horizon, strategic positioning aligned with the prevailing uptrend could yield favorable outcomes for traders navigating the AAVE
Technical Analyst: Kittiampon Somboonsod, CEWA
Source: visit Tradinglounge.com and learn From the Experts Join TradingLounge Here
See Previous: Ethereum/ U.S. dollar(ETHUSD)
TradingLounge Once Off SPECIAL DEAL: Here > 1 month Get 3 months.
