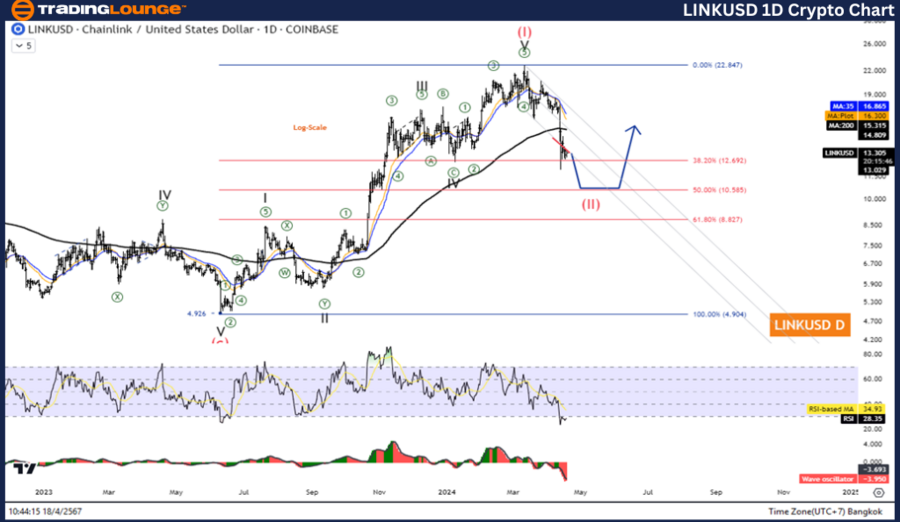
Elliott Wave Analysis of ChainLink/USD (LINKUSD) - Daily Chart Insight

LINKUSD Daily Chart Analysis

Elliott Wave Technical Analysis for LINKUSD

  • Function: Counter Trend
  • Mode: Corrective
  • Structure: Zigzag
  • Current Position: Wave C
  • Future Direction: Aiming for Wave (I) of an Impulse
  • Invalidation Point: $8.498
  • Detailed Insight: The correction in Wave (II) mirrors 61.8% of Wave (I), as seen on the logarithmic scale chart, pinpointing a critical level at $8.702.

Trading Strategy for ChainLink/USD (LINKUSD) Based on our Elliott Wave analysis, we anticipate a potential downturn for ChainLink, targeting the $10.585 mark as part of a second wave correction. Traders should prepare for a temporary pullback before the subsequent rise in the third wave. It's advisable to await the completion of this correction before re-entering the market to capitalize on the ascending trend.

LINKUSD Technical Indicators:

  • The market positioning above the 200-day moving average (MA200) suggests a prevailing downtrend. Additionally, our Wave Oscillator indicates bearish momentum, reinforcing the need for strategic entry points during this corrective phase.

LINKUSD-1D-Crypto-ch...


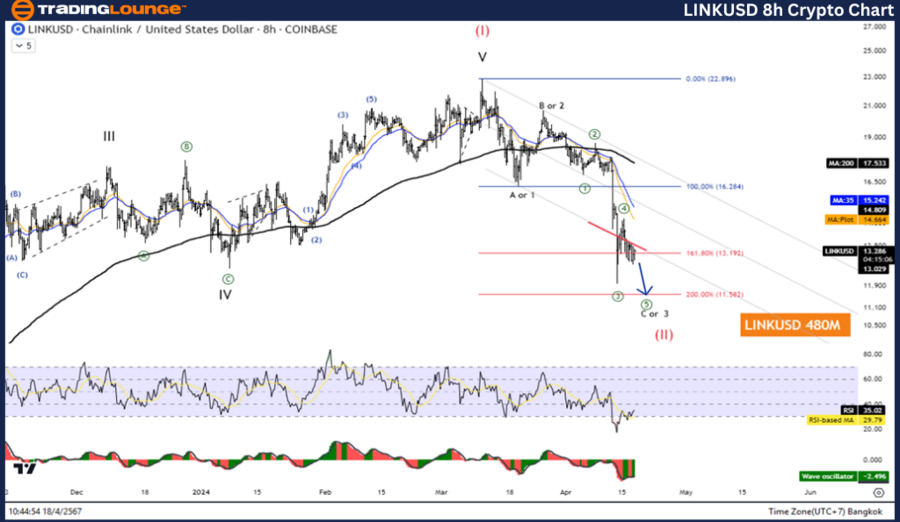
Elliott Wave Analysis of ChainLink/USD (LINKUSD) - 8-Hour Chart Overview

Elliott Wave Technical Analysis for LINKUSD

  • Function: Follow Trend
  • Mode: Motive
  • Structure: Impulse
  • Current Position: Wave 5
  • Future Direction: Progressing towards Wave ((C)) of a Zigzag
  • Invalidation Point: $81.238
  • Detailed Insight: The analysis foresees a descending trajectory within Wave ((C)), targeting the $11.582 level as part of a broader five-wave decline.

Trading Strategy for ChainLink/USD (LINKUSD) Our short-term analysis suggests that ChainLink may retest the $10.585 level, following the pathway of the second wave correction before mounting a rally in the third wave. Traders should monitor for completion of this correctional wave, providing an optimal juncture to align with the anticipated upward momentum.

Technical Indicators:

  • The presence above the MA200 indicates an ongoing downtrend, confirmed by bearish signals from the Wave Oscillator. These indicators are crucial for traders looking to optimize their market strategies during fluctuating price movements.

Technical Analyst: Kittiampon Somboonsod

Source: visit Tradinglounge.com and learn From the Experts Join TradingLounge Here 

See Previous: XRPUSD Elliott Wave Technical Analysis

TradingLounge Once Off SPECIAL DEAL: Here > 1 month Get 3 months.

TradingLounge's Free Week Extravaganza!

April 14 – 21: Unlock the Doors to Trading Excellence — Absolutely FREE

LINKUSD-8H-Crypto-ch...


Conclusion

In conclusion, the Elliott Wave analysis for ChainLink/USD (LINKUSD) offers a structured glimpse into potential future movements both in the daily and 8-hour chart scenarios. By closely monitoring the specified invalidation levels and corresponding corrective targets, traders can strategize effectively, using the insights provided by our technical indicators. As ChainLink approaches these critical junctures, adherence to a disciplined trading strategy will be key in leveraging potential market opportunities.

Related

Elliott Wave Insights: Major Indices & Exclusive Offer

Elliott Wave Insights: Major Indices & Exclusive Offer

This blog post offers an in-depth Elliott Wave analysis for major indices including the S&P 500, NAS...

Read More >
Unlocking Elliott Wave Insights: Commodity Market Analysis & Forecast Update

Unlocking Elliott Wave Insights: Commodity Market Analysis & Forecast Update

Commodity Market Elliott Wave Analysis for Bitcoin, Bonds, Yields, USD/ DXY, Gold, Silver, Iron Ore,...

Read More >
EURUSD Elliott Wave Technical Analysis Reveals Bullish Trends and Forecasts Potential Corrective Phases for Informed Forex Trading

EURUSD Elliott Wave Technical Analysis Reveals Bullish Trends and Forecasts Potential Corrective Phases for Informed Forex Trading

Our latest EURUSD Elliott Wave Analysis reveals a bullish trend, indicating the completion of orange...

Read More >
U.S.Dollar/Swiss Franc(USDCHF) Elliott Wave Technical Analysis 8 January 24

U.S.Dollar/Swiss Franc(USDCHF) Elliott Wave Technical Analysis 8 January 24

Trading Lounge USDCHF Elliott Wave Analysis dated 8 January 24, provides a comprehensive analysis of...

Read More >
CAR GROUP LIMITED (ASX:CAR) Elliott Wave Forecast: Key Technical Analysis, Trading Signals, Support and Resistance Levels

CAR GROUP LIMITED (ASX:CAR) Elliott Wave Forecast: Key Technical Analysis, Trading Signals, Support and Resistance Levels

CAR GROUP LIMITED (ASX:CAR) shows bullish potential with Elliott Wave analysis indicating a complete...

Read More >
Looking to buy Bovespa stocks, invest in index funds: Bovespa Index Elliott Wave Technical Analysis

Looking to buy Bovespa stocks, invest in index funds: Bovespa Index Elliott Wave Technical Analysis

This article offers a thorough Elliott Wave analysis of the Bovespa Index, providing valuable insigh...

Read More >

$1 for 2 Weeks

then $29 a month!

What a Special Offer!

Trade Recommendations

Unleash the power of deversified trading with our comprehensive portfolio, covering 250+ markets:

  • Stock Trades
  • Crypto Trades
  • Forex Trades
  • Commodity Trades
Elliott Wave Analysis

Gain a competitive edge with expert insights and AI-powered Elliott Wave charting into:

  • Global Indices
  • US Stocks & ASX Stocks
  • Forex & Crypto
  • Commodities
Top-Notch Trading Tools

Equip yourself with the tools of success:

  • Real-time Chat rooms
  • Elliott Wave Algorithm
  • Portfolio tools
  • TradingLevels
  • Screener
  • Trading Game
7 Elliott Wave Analysts

Stay ahead of the market with daily charts and insightful videos
Your secret to strategic trading!

JOIN HERE


Welcome to TradingLounge (ASIC A.R.No. 321187), specialists in trades, trading education and technical analysis, covering stocks, indices, commodities, forex and cryptocurrencies.

When you join TradingLounge you have access to everything we offer, including trade tools, educational content and a social platform to chat with like-minded investors.

Read more

@Copyright 2024 by tradinglounge.com

Contact Us

Australian no: 02 4787 6020

International no: +61 (2) 47876020

Pay with:

Find us on