04Dec

Mastering ASX Trading: V300AEQ ETF UNITS – VAS Stock Analysis & Elliott Wave Forecast

ASX: V300AEQ ETF UNITS – VAS Elliott Wave Technical Analysis TradingLounge

Greetings! This Elliott Wave analysis provides an updated perspective on the Australian Stock Exchange (ASX) and its V300AEQ ETF UNITS – VAS. The analysis identifies a bullish trend with ASX:VAS currently advancing in wave ((iii))-navy. However, a short-term retracement with wave (ii)-orange is anticipated before wave (iii)-orange resumes its upward momentum.

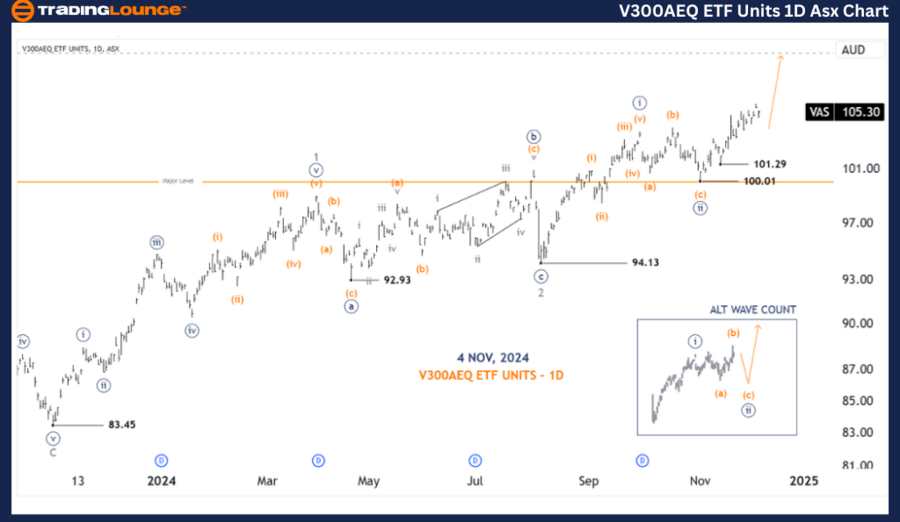
ASX: V300AEQ ETF UNITS – VAS 1D Chart (Semilog Scale) Analysis

Function: Major trend (Minor degree, grey)

Mode: Motive

Structure: Impulse

Position: Wave ((iii))-navy of Wave 3-grey

Details:
Wave ((iii))-navy is progressing higher, with a critical support level at 101.29. A breach below this level would suggest that the ALT (Alternate Wave Count) is in effect, implying wave ((ii))-navy has not yet concluded, leaving room for further downside movement.

Invalidation Point: 101.29

V300AEQ-ETF-UNITS-1d...


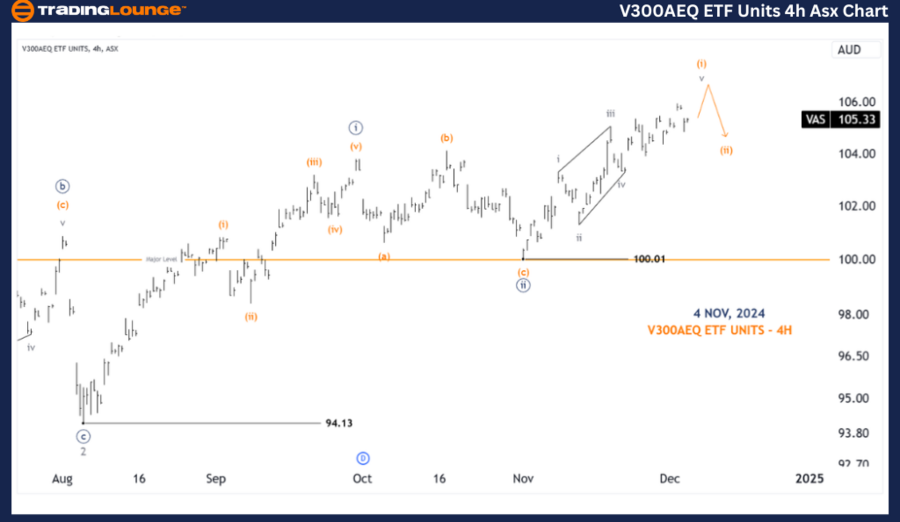
ASX: V300AEQ ETF UNITS – VAS 4-Hour Chart Analysis

Function: Major trend (Minute degree, navy)

Mode: Motive

Structure: Impulse

Position: Wave v-grey of Wave (i)-orange of Wave ((iii))-navy

Details:
From the recent low at 100.01, wave (i)-orange appears to be unfolding, albeit with overlapping structures indicative of a potential diagonal pattern. A pullback lower with wave (ii)-orange may occur before wave (iii)-orange drives the trend further upward.

Invalidation Point: 100.01

Technical Analyst: Hua (Shane) Cuong, CEWA-M (Master’s Designation).

Source: visit Tradinglounge.com and learn From the Experts Join TradingLounge Here 

See Previous: ASX: XERO LIMITED - XRO Elliott Wave Technical Analysis  

VALUE Offer - Buy 1 Month & Get 3 Months!Click here

Access 7 Analysts Over 200 Markets Covered. Chat Room With Support

V300AEQ-ETF-UNITS-4h...


Conclusion

This analysis delivers a comprehensive overview of the trends and potential price movements for ASX: V300AEQ ETF UNITS – VAS, offering actionable insights for traders. Validation and invalidation price levels are provided to bolster the reliability of the wave count, enhancing confidence in our forecast. By combining contextual trends with precise technical analysis, we aim to equip readers with the tools needed for informed trading decisions.

Related

 AUDUSD Elliott Wave Technical Forecast: Bearish Trend Insights and Key Price Levels

AUDUSD Elliott Wave Technical Forecast: Bearish Trend Insights and Key Price Levels

This in-depth AUDUSD Elliott Wave analysis reveals a bearish trend in the impulsive wave structure, ...

Read More >
Euro/British Pound EURGBP Forex Elliott Wave Technical Analysis: In-Depth Insights for Daily and 4-Hour Charts

Euro/British Pound EURGBP Forex Elliott Wave Technical Analysis: In-Depth Insights for Daily and 4-Hour Charts

Our EURGBP Elliott Wave Analysis provides a thorough examination of the Euro against the British Pou...

Read More >
KOSPI Composite Index Elliott Wave Technical Analysis: Indicates a Strong Bullish Trend with Significant Investment Potential

KOSPI Composite Index Elliott Wave Technical Analysis: Indicates a Strong Bullish Trend with Significant Investment Potential

The latest Elliott Wave analysis on the KOSPI Composite Index indicates a strong bullish trend with ...

Read More >
State Bank of India Stocks Elliott Wave Technical Analysis: Interpret Current Trends and Potential Future Price Movements

State Bank of India Stocks Elliott Wave Technical Analysis: Interpret Current Trends and Potential Future Price Movements

This in-depth technical analysis for the State Bank of India (SBIN) uses the Elliott Wave method to ...

Read More >
Insights into the Current Trends in the ASX Market: ASX LIMITED Stock Analysis & ASX Elliott Wave Technical Forecast

Insights into the Current Trends in the ASX Market: ASX LIMITED Stock Analysis & ASX Elliott Wave Technical Forecast

This article provides an in-depth Elliott Wave analysis of ASX Limited, focusing on its potential pr...

Read More >
The Coca-Cola KO Stock Forecast: Elliott Wave Analysis Predicts Bullish Wave 3 Breakout Toward $100 Price Target with Strong Momentum

The Coca-Cola KO Stock Forecast: Elliott Wave Analysis Predicts Bullish Wave 3 Breakout Toward $100 Price Target with Strong Momentum

Elliott Wave analysis of Coca-Cola (KO) reveals a bullish setup on both the daily and hourly charts....

Read More >

Buy 1 Month

Get 3 Months!

Special Offer:

Trade Recommendations

Unleash the power of deversified trading with our comprehensive portfolio, covering:

  • Stock Trades
  • Crypto Trades
  • Forex Trades
  • Commodity Trades
Elliott Wave Analysis

Gain a competive edge with expert insights in to:

  • Global Indices
  • US Stocks & ASX Stocks
  • Forex & Crypto
  • Commodities
Top-Notch Trading Tools

Equip yourself with the tools of success:

  • Social Chat
  • Elliott Wave Algorithm
  • Screener
  • TradingLevels
  • Trading Game
7 Elliott Wave Analysts

Stay ahead of the market with daily charts and insightful videos
-Your secret to strategic trading!

JOIN HERE


Welcome to TradingLounge (ASIC A.R.No. 321187), specialists in trades, trading education and technical analysis, covering stocks, indices, commodities, forex and cryptocurrencies.

When you join TradingLounge you have access to everything we offer, including trade tools, educational content and a social platform to chat with like-minded investors.

Read more

@Copyright 2024 by tradinglounge.com

Contact Us

Australian no: 02 4787 6020

International no: +61 (2) 47876020

Pay with:

Find us on