28Jan

Chainlink (LINKUSD) Elliott Wave Analysis: Fibonacci Targets, Key Support & Resistance Levels for Crypto Trading Success

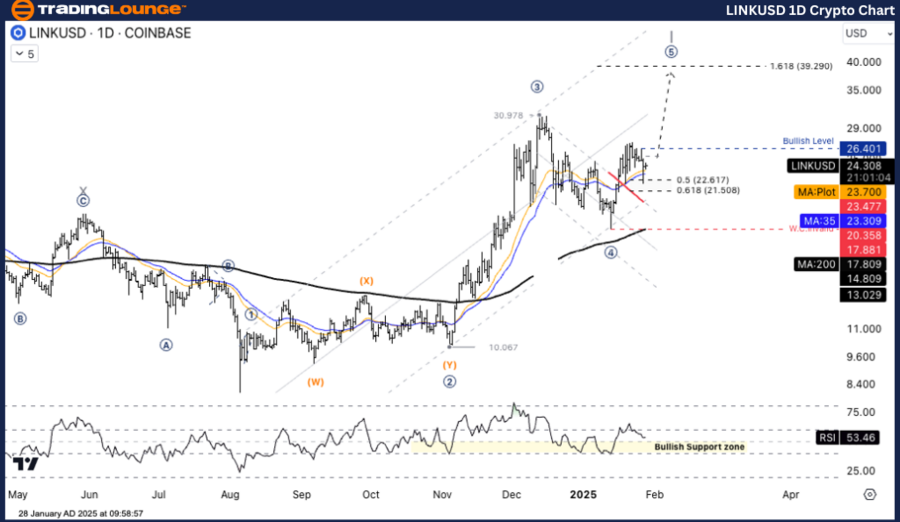
LINK/USD (LINKUSD) Elliott Wave Analysis - TradingLounge Daily Chart

LINKUSD Elliott Wave Technical Analysis

Function: Follow Trend

Mode: Motive

Structure: Impulse

Position: Wave ((5))

Next Higher Degree Direction: Wave I of Impulse

Wave Cancel Invalid Level: $17.88

Details:
Wave (5) is projected to target $39.29, derived from the Fibonacci 1.618 extension of preceding waves. This aligns with Elliott Wave Theory's expectations for Wave V, signifying the potential for a continued bullish trend.

LINK/USD Trading Strategy

LINK/USD has entered Wave (5), maintaining its bullish trajectory. As long as prices stay above the critical support level, a break of the $30.978 resistance could establish a stronger, long-term uptrend. Traders are advised to observe wave structures and price levels carefully for strategy adjustments.

Trading Strategies:

  • Support Level Confirmation: If Ethereum sustains support at $2,899.73 and shows signs of reversal, Wave II may be confirmed as completed.
  • Entry Opportunity: Consider entering within the $22.617–$21.508 correction range after confirming a reversal signal.
  • Profit Targets: Set a short-term target at $30,000 and a long-term target at $39,290.
  • Stop Loss Placement: Place Stop Loss below $20.358 to safeguard against wave structure invalidation.

linkusd-1d-crypto-ch...


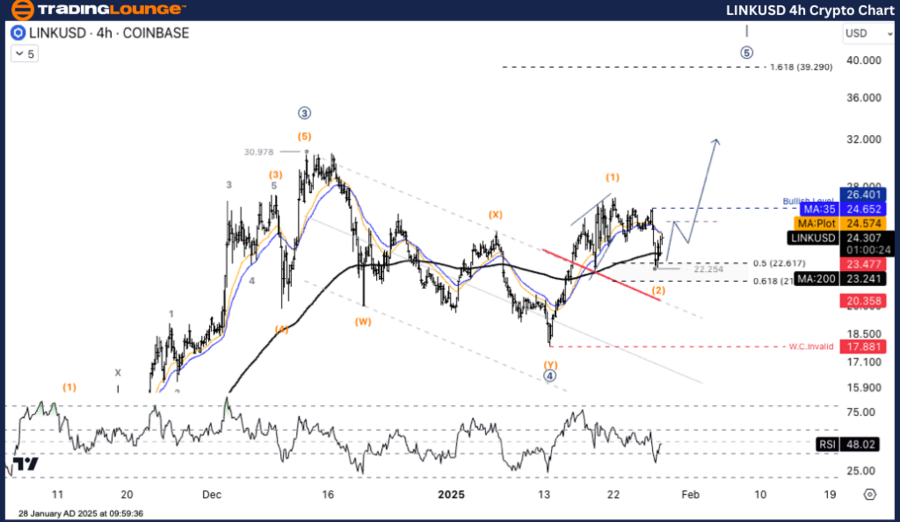
LINK/USD (LINKUSD) Elliott Wave Analysis - TradingLounge H4 Chart

LINKUSD Elliott Wave Technical Analysis

Function: Follow Trend

Mode: Motive

Structure: Impulse

Position: Wave (2)

Next Higher Degree Direction: Wave ((5))

Wave Cancel Invalid Level: Not specified

Details:
A confirmed breakout above $26.40 signals the start of Wave (3) within Wave ((5)), supporting a continued bullish trend for LINK/USD.

LINK/USD Trading Strategy

LINK/USD remains in the formative phase of Wave (5) with strong upward momentum. If the price holds above the key support level and exceeds the $30.978 resistance, the uptrend is expected to sustain. Monitoring wave structures and critical price points is crucial for effective strategy refinement.

Trading Strategies:

  • Support and Reversal Confirmation: If Ethereum maintains support at $2,899.73 and reverses, this confirms Wave II has ended.
  • Buying Range: Enter the market within the correction range of $22.617–$21.508 after observing a clear reversal signal.
  • Profit Targets: Short-term target at $30,000, with a long-term target of $39,290.
  • Stop Loss Placement: To minimize risk, position your Stop Loss below $20.358, protecting against unexpected wave changes.

Technical Analyst: Kittiampon Somboonsod

Source: visit Tradinglounge.com and learn From the Experts Join TradingLounge Here 

Previous: ETHUSD Elliott Wave Technical Analysis

VALUE Offer - Buy 1 Month & Get 3 Months!Click here

Access 7 Analysts Over 200 Markets Covered. Chat Room With Support

linkusd-4h-crypto-ch...

Related

Elliott Wave Analysis and Trading Strategies for NASDAQ Tech Stocks

Elliott Wave Analysis and Trading Strategies for NASDAQ Tech Stocks

The summary of the Elliott Wave analysis for NASDAQ tech stocks indicates that there might be a pote...

Read More >
Natural Gas Commodity Elliottwave Technical Analysis: Potential Implications for Future Price Movements

Natural Gas Commodity Elliottwave Technical Analysis: Potential Implications for Future Price Movements

This article provides a comprehensive Elliott Wave analysis of the natural gas market. It discusses ...

Read More >
JSW Steel Elliott Wave Analysis: Stock Forecast, Share Price Outlook, Technical Strategy & Long-Term Investment Insights

JSW Steel Elliott Wave Analysis: Stock Forecast, Share Price Outlook, Technical Strategy & Long-Term Investment Insights

Elliott Wave analysis of JSW Steel, covering both daily and weekly charts. It highlights the bullish...

Read More >
BPCL Indian Stocks Elliott Wave Technical Analysis - BPCL Share Price, Helping Traders and Investors Make Informed Decisions

BPCL Indian Stocks Elliott Wave Technical Analysis - BPCL Share Price, Helping Traders and Investors Make Informed Decisions

BPCL stock has shown a strong corrective wave pattern, indicating potential short-term rallies befor...

Read More >
Adani Enterprises Elliott Wave Analysis: Technical Insights, Price Predictions, and Chart Analysis for Informed Trading Decisions

Adani Enterprises Elliott Wave Analysis: Technical Insights, Price Predictions, and Chart Analysis for Informed Trading Decisions

A comprehensive Elliott Wave analysis of Adani Enterprises discovers insights into the stock's c...

Read More >

$1 for 2 Weeks

then $29 a month!

What a Special Offer!

Trade Recommendations

Unleash the power of deversified trading with our comprehensive portfolio, covering 250+ markets:

  • Stock Trades
  • Crypto Trades
  • Forex Trades
  • Commodity Trades
Elliott Wave Analysis

Gain a competitive edge with expert insights and AI-powered Elliott Wave charting into:

  • Global Indices
  • US Stocks & ASX Stocks
  • Forex & Crypto
  • Commodities
Top-Notch Trading Tools

Equip yourself with the tools of success:

  • Real-time Chat rooms
  • Elliott Wave Algorithm
  • Portfolio tools
  • TradingLevels
  • Screener
  • Trading Game
7 Elliott Wave Analysts

Stay ahead of the market with daily charts and insightful videos
Your secret to strategic trading!

JOIN HERE


Welcome to TradingLounge (ASIC A.R.No. 321187), specialists in trades, trading education and technical analysis, covering stocks, indices, commodities, forex and cryptocurrencies.

When you join TradingLounge you have access to everything we offer, including trade tools, educational content and a social platform to chat with like-minded investors.

Read more

@Copyright 2024 by tradinglounge.com

Contact Us

Australian no: 02 4787 6020

International no: +61 (2) 47876020

Pay with:

Find us on