Euro Stoxx 50 Elliott Wave Analysis Trading Lounge Day Chart
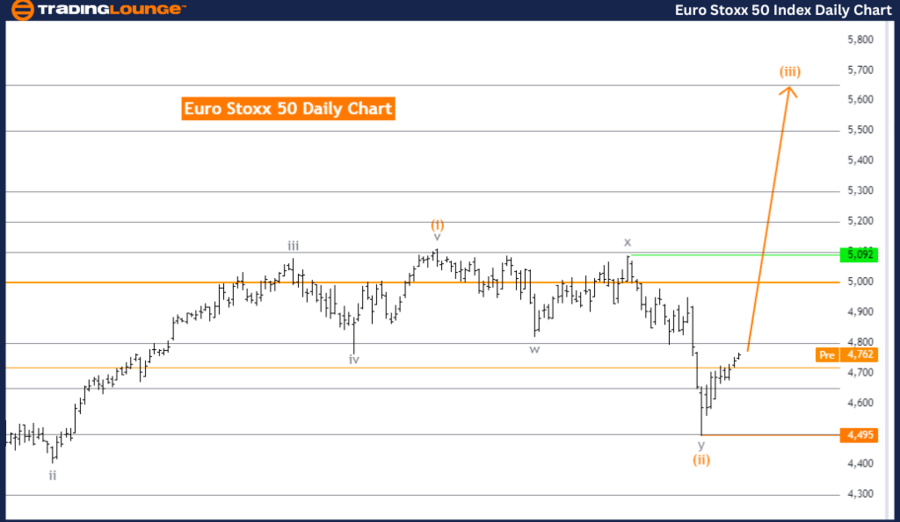
Euro Stoxx 50 Day Chart Analysis
Euro Stoxx 50 Elliott Wave Technical Analysis
Function: Trend
Mode: Impulsive
Structure: Orange wave 3
Position: Navy blue wave 3
Direction Next Higher Degrees: Orange wave 3 (started)
Details: Orange wave 2 of navy blue wave 3 appears complete. Orange wave 3 is now active. Wave Cancel invalid level: 4495.
The Euro Stoxx 50 daily chart reflects a trend mode per Elliott Wave analysis, exhibiting an impulsive wave structure. The focus is on orange wave 3, indicating a robust upward movement in the market. This impulsive mode signifies the continuation of the broader trend, characterized by a series of advancing waves.
Currently, the market resides within navy blue wave 3, which is part of the larger orange wave 3 structure. The completion of orange wave 2 within this navy blue wave 3 suggests the end of the corrective phase, leading to an advancement within the impulsive orange wave 3. This progression is typical in Elliott Wave analysis, where, following a correction, the market resumes its dominant trend with heightened momentum.
The next higher degree direction remains with orange wave 3, already in progress. This indicates that the market is likely to maintain its upward path, continuing further within the impulsive wave structure. The commencement of orange wave 3 after completing orange wave 2 within navy blue wave 3 underscores that the market is in a strong, potentially extended trend phase.
The wave cancel invalid level is set at 4495. A breach of this level would invalidate the current wave count, signaling a possible shift in the market structure or an alternative wave formation.
Summary: The Euro Stoxx 50 daily chart is in an impulsive mode, with the market positioned within navy blue wave 3 as part of the larger orange wave 3 structure. The completion of orange wave 2 suggests trend continuation, with orange wave 3 now active. The wave cancellation invalid level at 4495 is crucial for confirming the validity of this analysis.
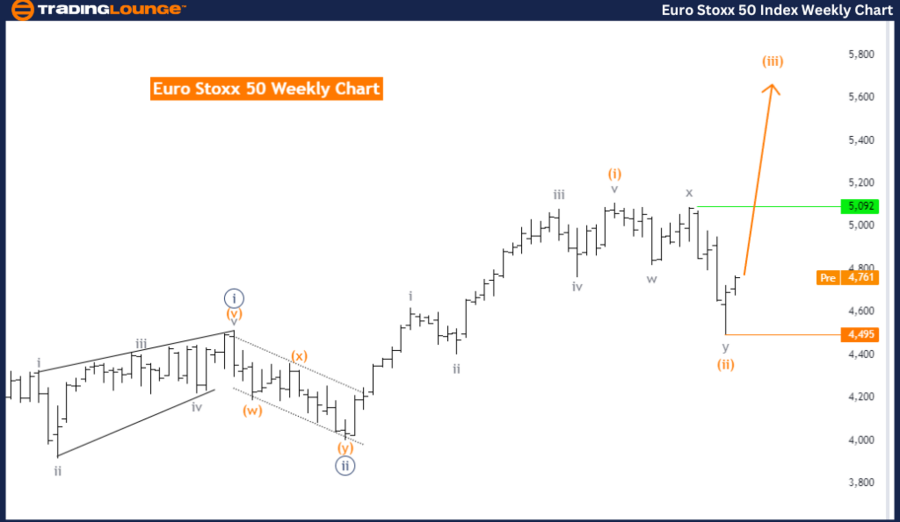
Euro Stoxx 50 Elliott Wave Analysis Trading Lounge Weekly Chart
Euro Stoxx 50 Elliott Wave Technical Analysis
Function: Trend
Mode: Impulsive
Structure: Orange wave 3
Position: Navy Blue Wave 3
Direction Next Higher Degrees: Orange wave 3 (started)
Details: Orange wave 2 of navy blue wave 3 appears complete. Orange wave 3 is now active. Wave Cancel invalid level: 4495.
The Euro Stoxx 50 weekly chart reflects a trend mode with an impulsive structure per Elliott Wave analysis. The primary wave structure being analyzed is orange wave 3, signaling a strong upward movement in the market. This impulsive trend suggests that the market is in an expansion phase, marked by upward momentum and continuation of the prevailing trend.
The market's current position lies within navy blue wave 3, a component of the larger orange wave 3 structure. The completion of orange wave 2 within navy blue wave 3 indicates the end of a corrective phase, with the market now advancing within the impulsive orange wave 3. This is consistent with Elliott Wave theory, where corrections are typically followed by renewed movement in the direction of the dominant trend.
The direction at the next higher degree continues with orange wave 3, which has already commenced. This suggests that the market is expected to maintain its upward trajectory, progressing further within the impulsive wave structure. The initiation of orange wave 3 following the completion of orange wave 2 within navy blue wave 3 indicates that the market is in a strong trend phase, likely to extend further.
The wave cancel invalid level is set at 4495, acting as a critical threshold. A move below this level would invalidate the current wave count, implying a potential shift in the market structure or an alternative wave pattern.
Summary: The Euro Stoxx 50 weekly chart is in an impulsive trend mode, with the market positioned within navy blue wave 3 as part of the larger orange wave 3 structure. The completion of orange wave 2 indicates trend continuation, with orange wave 3 now in progress. The wave cancel invalid level at 4495 is essential for confirming this analysis.
Technical Analyst: Malik Awais
Source: visit Tradinglounge.com and learn From the Experts Join TradingLounge Here
See previous: Swiss Market Index Elliott Wave Technical Analysis
Special Trial Offer - 0.76 Cents a Day for 3 Months! Click here
Access 7 Analysts Over 170 Markets Covered. Chat Room With Support