SMH Elliott Wave Analysis | VanEck Semiconductor ETF Forecast
This Elliott Wave update provides a technical overview of the VanEck Semiconductor ETF (SMH), examining its current wave position across both daily and hourly charts. Analysis suggests a bullish continuation, with wave counts offering key insights into future market developments.
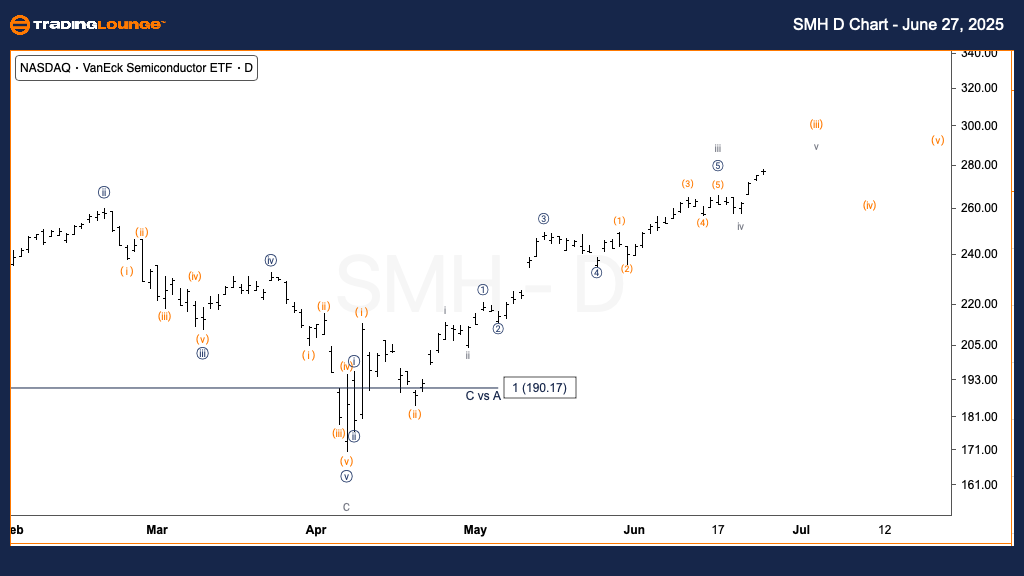
VanEck Semiconductor ETF (SMH) Daily Chart
SMH Elliott Wave Technical Outlook
FUNCTION: Trend
MODE: Motive
STRUCTURE: Impulsive
POSITION: Wave (iii) of {iii}
DIRECTION: Uptrend in wave (iii)
DETAILS: The ETF is progressing through wave v of (iii), pushing toward the $300 resistance level (TradingLevel3). Momentum and wave structure confirm SMH is within a strong third wave of a third wave, known for its sharp and extended rallies.
Daily Chart Summary:
SMH continues to demonstrate strength in wave (iii) of {iii}, a phase typically marked by aggressive upward movement. As it approaches the $300 target, the bullish Elliott Wave pattern remains valid.
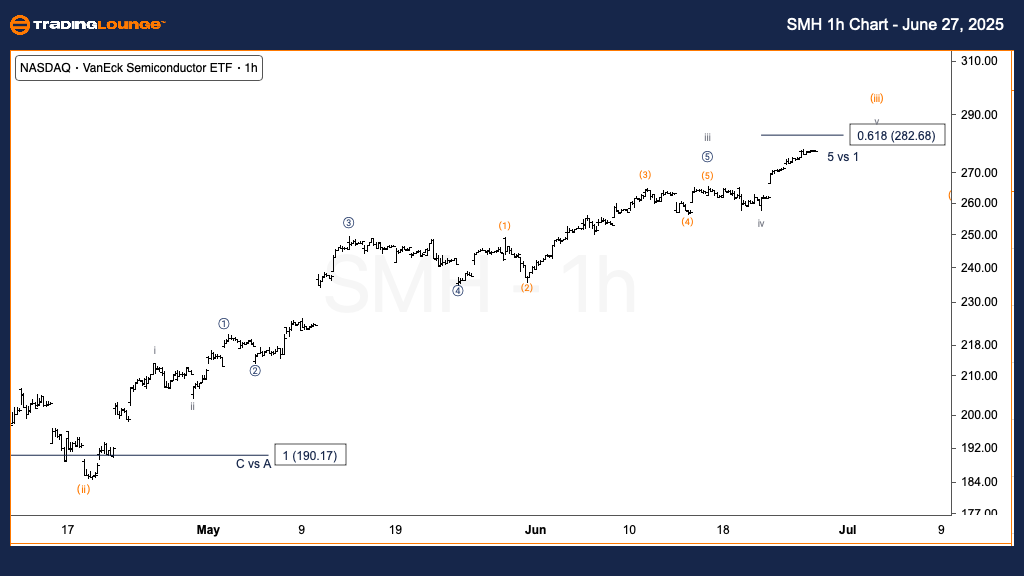
VanEck Semiconductor ETF (SMH) 1-Hour Chart
SMH Elliott Wave Technical Outlook
FUNCTION: Trend
MODE: Motive
STRUCTURE: Impulsive
POSITION: Wave v of (iii)
DIRECTION: Nearing top of wave v
DETAILS: SMH appears to be finalizing wave v of (iii). A Fibonacci extension places the first resistance at $282, a typical 0.618 projection from wave i. This price level may act as a short-term peak, followed by a potential wave (iv) correction.
1H Chart Summary:
SMH seems to be approaching the completion of wave v of (iii), with $282 as the initial resistance target. A short pullback in wave (iv) could follow, offering a new entry opportunity in the broader uptrend.
Technical Analyst: Alessio Barretta
Source: Visit Tradinglounge.com and learn from the Experts. Join TradingLounge Here
See Previous: Grayscale Ethereum Trust ETF (ETHE) Elliott Wave Technical Analysis
VALUE Offer - Buy 1 Month & Get 3 Months!Click here
Access 7 Analysts Over 200 Markets Covered. Chat Room With Support