CAC 40 (France) Elliott Wave Analysis – Trading Lounge Day Chart
CAC 40 (France) Day Chart Analysis
CAC 40 (France) Elliott Wave Technical Analysis
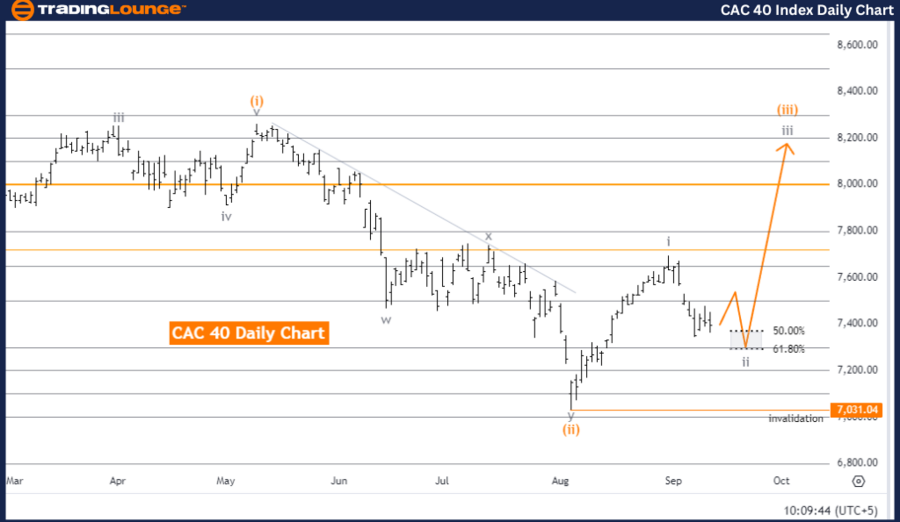
The CAC 40 Elliott Wave analysis for the daily chart suggests that the index is undergoing a corrective counter-trend phase, specifically within gray wave 2, which is part of orange wave 3. This corrective movement is indicative of a temporary consolidation before the index potentially resumes its impulsive trend.
At present, gray wave 1 appears completed, with gray wave 2 of orange wave 3 currently developing. This means the index is in a retracement phase, typically seen in wave 2 under Elliott Wave Theory. Upon completion of this correction, the market is expected to resume its bullish trend, moving into gray wave 3, which is a higher degree wave within the ongoing orange wave 3.
The next higher degree movement points toward gray wave 3, expected to initiate after the current corrective phase concludes. This would mark a return to bullish momentum, with the index likely advancing in the next impulsive wave.
It's important to note the wave cancel invalid level at 7,031.04. If the price drops below this level, the current wave count will be invalid, necessitating a reanalysis. However, as long as the price remains above this threshold, the wave count remains valid, and the market is likely to continue moving through gray wave 2, followed by the onset of gray wave 3.
Summary: The CAC 40 is currently in gray wave 2 of orange wave 3. After the correction concludes, the market is anticipated to enter gray wave 3. The wave count remains valid unless the price dips below 7,031.04.
CAC 40 (France) Elliott Wave Analysis – Trading Lounge Weekly Chart
CAC 40 (France) Elliott Wave Technical Analysis
-
Function: Bullish Trend
-
Mode: Impulsive
-
Structure: Orange wave 3
-
Position: Navy Blue Wave 3
-
Direction Next Higher Degrees: Orange wave 3 (started)
-
Details: Orange wave 2 appears completed. Now, orange wave 3 of 3 is in play.
- Wave Cancel Invalid Level: 7,031.04
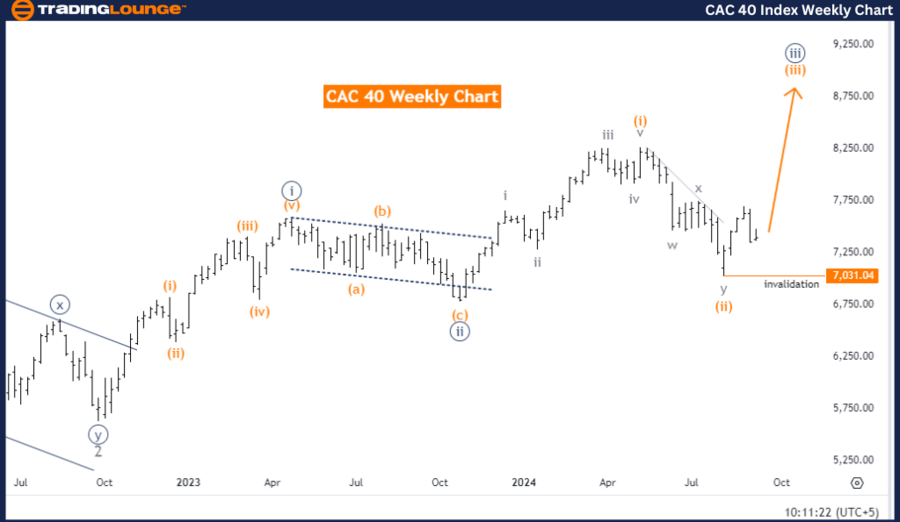
The weekly Elliott Wave analysis for the CAC 40 index highlights a bullish trend within an impulsive mode, with the focus on orange wave 3. The current position of the market is within navy blue wave 3, suggesting a strong upward momentum, characteristic of wave 3 movements in Elliott Wave Theory.
According to the analysis, orange wave 2 seems completed, and now the index is advancing in orange wave 3 of 3. This transition indicates the market has exited its corrective phase and is now in a powerful impulsive wave pushing the index higher. As orange wave 3 continues, the bullish trend is expected to persist, with the index moving through various stages of wave 3.
The next higher degree indicates the continuation of orange wave 3, which has already begun, signaling further upward momentum in the near term.
The wave cancellation level is again set at 7,031.04. If the price falls below this level, the current wave structure would become invalid, requiring a reassessment of the wave count. However, as long as the price remains above this invalidation point, the impulsive wave count holds, and the market is expected to continue rising as orange wave 3 progresses.
Summary: The CAC 40 weekly chart points to a strong bullish trend with orange wave 3 in progress. The index is in navy blue wave 3, and the impulsive movement is expected to continue as long as the price stays above 7,031.04.
Technical Analyst: Malik Awais
Source: visit Tradinglounge.com and learn From the Experts Join TradingLounge Here
Previous: TASI index Elliott Wave Technical Analysis
Special Trial Offer - 0.76 Cents a Day for 3 Months! Click here
Access 7 Analysts Over 200 Markets Covered. Chat Room With Support