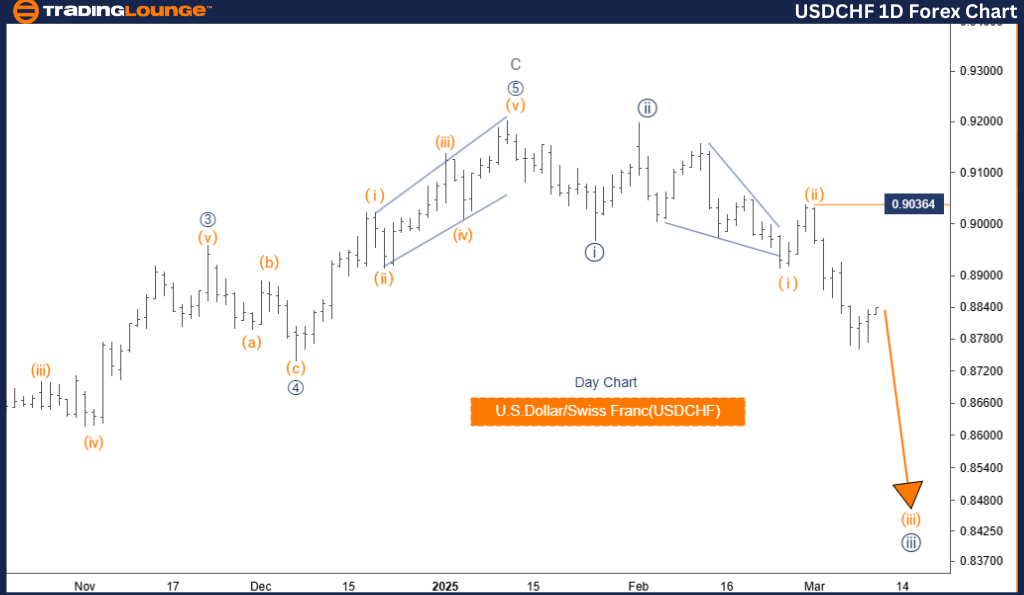
U.S. Dollar / Swiss Franc (USDCHF) – TradingLounge Daily Chart
U.S. Dollar / Swiss Franc (USDCHF) Daily Chart Analysis
USDCHF Elliott Wave Technical Analysis
Trend Function: Bearish
Market Mode: Impulsive
Wave Structure: Orange Wave 3
Current Position: Navy Blue Wave 3
Next Higher Degree Movement: Orange Wave 4
Wave Invalidation Level: 0.90364
USDCHF Analysis Overview
The USDCHF Elliott Wave Analysis on the daily chart indicates a strong bearish trend, with an impulsive wave structure in play. Currently, orange wave 3 is progressing within a larger navy blue wave 3, reinforcing the overall downward momentum.
The prior corrective wave (orange wave 2) appears to have completed, paving the way for the continuation of orange wave 3. This phase is expected to extend further downward before transitioning into orange wave 4, which would act as a corrective movement against the prevailing downtrend.
Key Trading Insights
- Critical price levels must be closely monitored to assess market behavior.
- Wave invalidation level: 0.90364 – a break above this level would invalidate the current wave structure.
- If price breaches 0.90364, a reassessment of trading strategies will be necessary.
- The Elliott Wave pattern suggests further declines, with wave 3 still unfolding before a potential correction in wave 4.
- Traders should analyze price action and wave patterns to determine optimal entry and exit points.
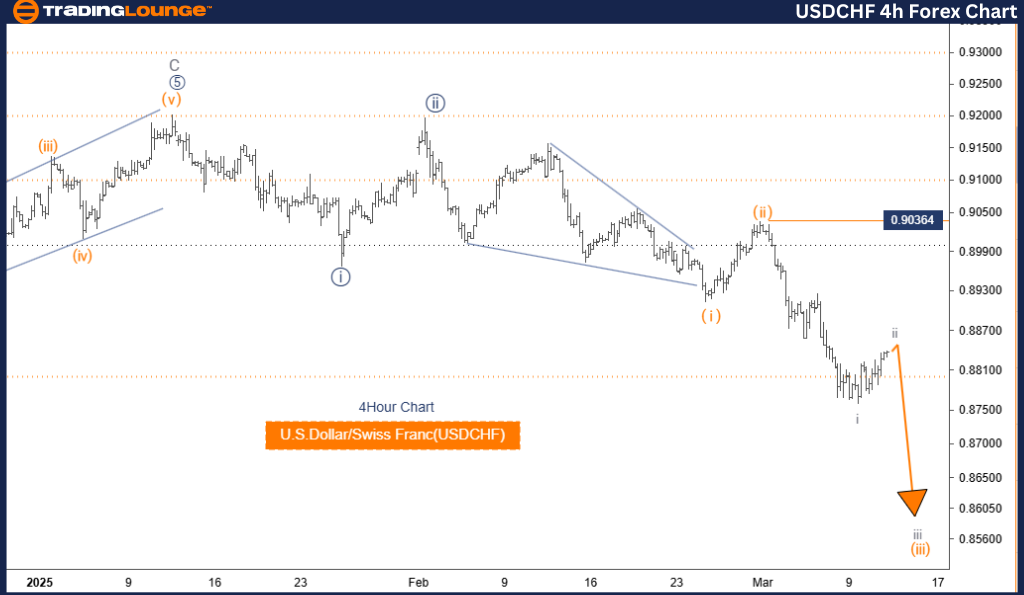
U.S. Dollar / Swiss Franc (USDCHF) – 4-Hour Chart
USDCHF Elliott Wave Technical Analysis
Trend Function: Counter Trend
Market Mode: Corrective
Wave Structure: Gray Wave 2
Current Position: Orange Wave 3
Next Lower Degree Movement: Gray Wave 3
Wave Invalidation Level: 0.90364
U.S. Dollar / Swiss Franc Currency Pair Analysis Overview
On the 4-hour chart, the USDCHF Elliott Wave Analysis presents a corrective phase, indicating a temporary counter-trend movement. The market is currently in gray wave 2, which is part of the larger corrective structure within orange wave 3.
The previous gray wave 1 has likely concluded, and the market is transitioning into gray wave 2, which is expected to show sideways or upward movement before the next impulsive wave (gray wave 3) begins. The completion of gray wave 2 is a key moment for traders, as it may mark the start of the next downward wave 3 impulse.
Key Trading Insights
- Wave 2 corrections often involve sideways consolidation or mild retracements before the broader trend resumes.
- Wave invalidation level: 0.90364 – a break above this level would invalidate the current wave count.
- If price breaches this level, a market reevaluation is needed to determine if a trend shift is occurring.
- Gray wave 3 is expected to continue the downward trend, making the completion of gray wave 2 a key area for trade setups.
- Traders should closely monitor price action for confirmation of wave 2 completion, as this can signal potential entry points.
- This USDCHF Elliott Wave Analysis provides valuable insights into the current market structure, helping traders anticipate future price movements and develop strategic trading plans based on the Elliott Wave Theory.
Technical Analyst: Malik Awais
Source: Visit Tradinglounge.com and learn from the Experts Join TradingLounge Here
Previous: AUDUSD Elliott Wave Technical Analysis
VALUE Offer - Buy 1 Month & Get 3 Months!Click here
Access 7 Analysts Over 200 Markets Covered. Chat Room With Support