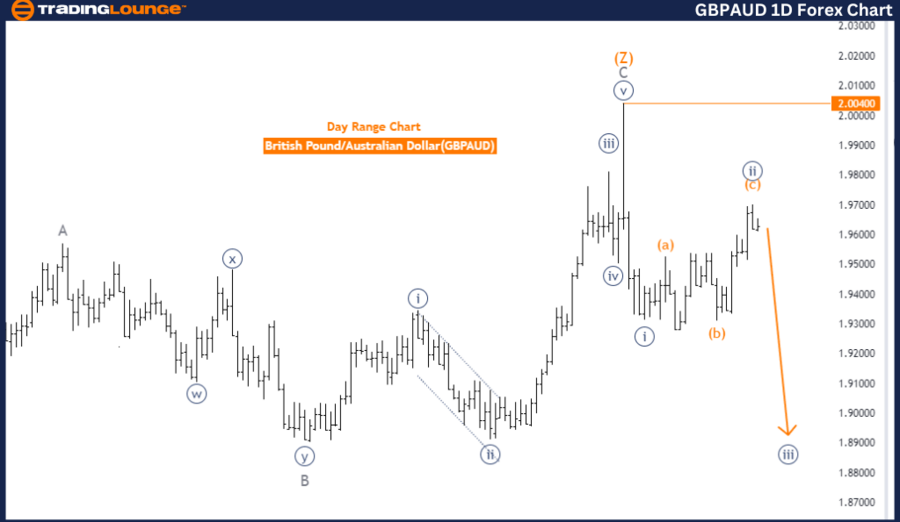
GBPAUD Elliott Wave Analysis - Daily Chart Overview
GBPAUD Elliott Wave Technical Analysis
Trend: Bearish
Mode: Impulsive
Structure: Navy blue wave 3
Position: Gray wave 1
Next Direction: Lower levels, navy blue wave 3 in progress
Wave Cancellation Invalid Level: 2.00400
Analysis Breakdown
The GBPAUD Elliott Wave analysis on the daily chart highlights a bearish trend. The market is in an impulsive mode, which points to strong downward momentum. The current structure being followed is navy blue wave 3, which indicates continued downward movement in line with the overall bearish trend.
The pair is currently positioned in gray wave 1, a part of the broader navy blue wave 3. This signifies that the market is in the early stages of a downward impulsive wave, with additional declines anticipated as the wave progresses.
It appears that navy blue wave 2, a corrective phase, has completed. This completion paves the way for navy blue wave 3, resuming the larger bearish trend. As this wave unfolds, the price is expected to decline further, reinforcing the overall downtrend.
A wave cancellation invalidation level is set at 2.00400. If the price moves above this level, the current Elliott Wave structure would be invalid, requiring a re-assessment of the market outlook. However, as long as the price stays below this level, the bearish trend remains intact, and further price declines are likely as part of navy blue wave 3.
Summary
The GBPAUD daily chart shows a strong bearish trend with navy blue wave 3 currently in progress. The completion of navy blue wave 2 suggests a return to a downward move, and as long as the price remains below 2.00400, the bearish outlook stays in place with more downside potential.
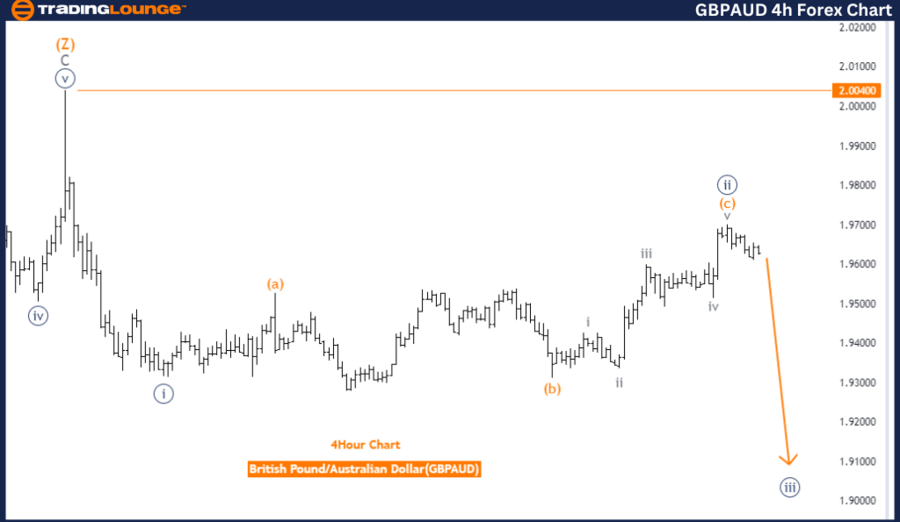
GBPAUD Elliott Wave Analysis - 4-Hour Chart Overview
GBPAUD Elliott Wave Technical Analysis
Trend: Bearish
Mode: Impulsive
Structure: Navy blue wave 3
Position: Gray wave 1
Next Direction: Lower levels, navy blue wave 3 in progress
Wave Cancellation Invalid Level: 2.00400
Analysis Breakdown
The GBPAUD Elliott Wave analysis on the 4-hour chart confirms a bearish trend. The market is currently in an impulsive mode, indicating strong downward momentum. The primary structure being tracked is navy blue wave 3, pointing towards further downside movement in alignment with the overall bearish trend.
The market is now positioned in gray wave 1, which is part of the broader navy blue wave 3. This indicates that the market is in the early stages of a downward impulsive wave, with further price declines expected as the wave unfolds.
The completion of navy blue wave 2, a corrective phase, has led to the start of navy blue wave 3, which marks the continuation of the downward impulsive movement. This phase is likely to push prices lower in line with the broader trend.
The analysis provides a wave cancellation invalid level at 2.00400. If the price moves above this level, the current Elliott Wave count would be invalid, and a re-evaluation of the market outlook would be necessary. However, as long as the price remains below this level, the bearish trend is likely to persist, and further downside movement is expected as part of navy blue wave 3.
Summary
The GBPAUD 4-hour chart presents a strong bearish trend with navy blue wave 3 currently unfolding. The end of navy blue wave 2 signals the start of a new downward impulsive wave. As long as the price remains below 2.00400, the bearish outlook continues with further price declines expected.
Technical Analyst: Malik Awais
Source: visit Tradinglounge.com and learn From the Experts Join TradingLounge Here
Previous:AUDUSD Elliott Wave Technical Analysis
Special Trial Offer - 0.76 Cents a Day for 3 Months! Click here
Access 7 Analysts Over 200 Markets Covered. Chat Room With Support