Elliott Wave Analysis of Meta Platforms Inc. (META): Daily and 4-Hour Charts Insights

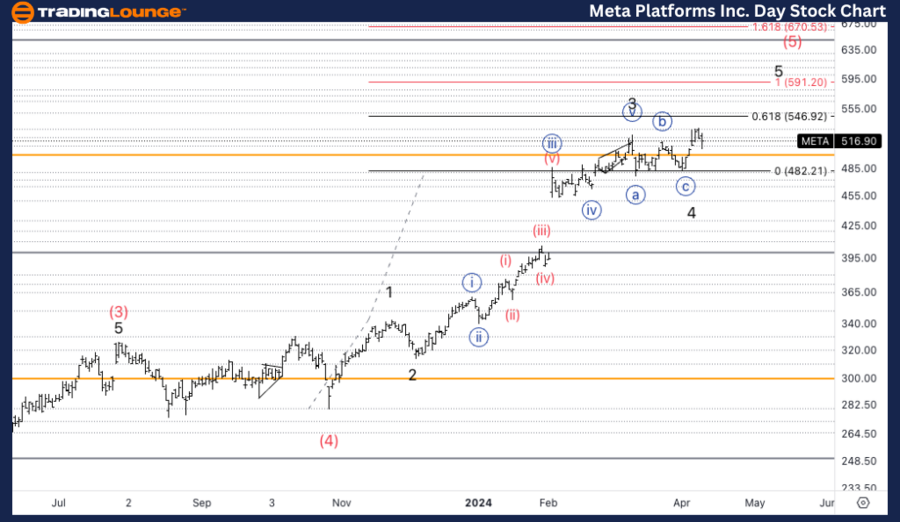
META's Daily Chart Elliott Wave Overview

In the realm of technical analysis for Meta Platforms Inc. (META), the Elliott Wave principle offers a nuanced view of the stock's current trajectory and potential future movements. Focusing on the daily chart, the analysis situates META within a crucial juncture of its price evolution.

META Elliott Wave Technical Analysis

FUNCTION: Trend

MODE: Impulse

STRUCTURE: Motive

POSITION: Minor 5

DIRECTION: Upside in wave 5 of (5).  

DETAILS: Looking for continuation higher towards equality of 5 vs. 1 at 600$.  

Our analysis reveals a trending function characterized by impulse mode and motive structure, positioned in Minor 5. The direction indicates upside movement in wave 5 of (5). We anticipate further upward continuation, targeting the equality of 5 vs. 1 at $600.

Meta-Platforms-Inc-1...


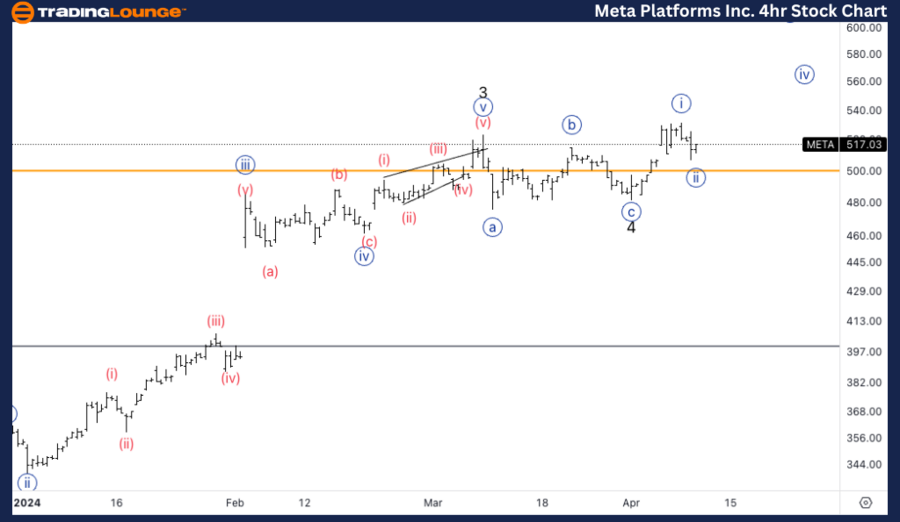
META Elliott Wave Analysis Trading Lounge 4Hr Chart,

Expanding the analysis to the 4-hour chart of Meta Platforms Inc. (META) enriches the understanding of its short-term movements and provides investors with critical insights into immediate trends.

Meta Platforms Inc., (META) 4Hr Chart Analysis

Elliott Wave Technical Analysis of META Stock

FUNCTION: Trend

MODE: Impulse

STRUCTURE: Motive

POSITION: Wave {iii} of 5.  

DIRECTION: Acceleration higher into wave {iii}

DETAILS: Looking for further upside into wave {iii}, with an invalidation level at 480$, we are now sitting at the previous higher of around 520 and we need to take off from Miner Group 2 at 530$ to then start aiming for an upside target at 600$.

Conclusion: Prospects for Meta Platforms Inc. (META)

The comprehensive Elliott Wave analysis of Meta Platforms Inc. (META) across both daily and 4-hour charts underscores a pronounced bullish sentiment. With the stock anticipated to progress through critical phases of its Elliott Wave formation, investors and traders are advised to monitor these key levels closely. The potential for META to achieve and even surpass the $600 price target hinges on its ability to navigate upcoming wave milestones effectively. As always, staying attuned to the intricacies of Elliott Wave patterns can provide valuable foresights into the stock's future direction.

Technical Analyst: Alessio Barretta

Source: visit Tradinglounge.com and learn From the Experts Join TradingLounge Here 

See Previous: Alphabet Inc., (GOOGL) 

TradingLounge Once Off SPECIAL DEAL: Here > 1 month Get 3 months.

TradingLounge's Free Week Extravaganza!

April 14 – 21: Unlock the Doors to Trading Excellence — Absolutely FREE

Meta-Platforms-Inc-4...

Related

Elliott Wave Analysis: SP500, NASDAQ, DAX & More | Expert Trade Setups by Peter Mathers

Elliott Wave Analysis: SP500, NASDAQ, DAX & More | Expert Trade Setups by Peter Mathers

In this Elliott Wave analysis, Peter Mathers from TradingLounge™ examines the current "Risk On...

Read More >
MACQUARIE GROUP LIMITED MQG Elliott Wave Analysis – Trading Strategy, and Technical Analysis for ASX Investors

MACQUARIE GROUP LIMITED MQG Elliott Wave Analysis – Trading Strategy, and Technical Analysis for ASX Investors

Elliott Wave analysis of ASX: Macquarie Group Limited (MQG), focusing on current market trends, pric...

Read More >
ASX Sonic Healthcare Limited SHL Elliott Wave Analysis: Price Prediction, Key Resistance & Support Levels for Bullish Breakout

ASX Sonic Healthcare Limited SHL Elliott Wave Analysis: Price Prediction, Key Resistance & Support Levels for Bullish Breakout

Elliott Wave analysis on ASX: SHL highlights potential bullish trends for Sonic Healthcare Limited. ...

Read More >
Discover Polkadot Price Analysis and Market Trends with DOTUSD Elliott Wave Technical Analysis

Discover Polkadot Price Analysis and Market Trends with DOTUSD Elliott Wave Technical Analysis

Discover in-depth Polkadot price analysis and Elliott Wave forecasts to enhance your trading strateg...

Read More >
CAC 40 (France) Index Elliott Wave Technical Analysis: Provides detailed insights into the French stock market index

CAC 40 (France) Index Elliott Wave Technical Analysis: Provides detailed insights into the French stock market index

The CAC 40 Elliott Wave Analysis provides detailed insights into the French stock market index, focu...

Read More >

Buy 1 Month

Get 3 Months!

Special Offer:

Trade Recommendations

Unleash the power of deversified trading with our comprehensive portfolio, covering:

  • Stock Trades
  • Crypto Trades
  • Forex Trades
  • Commodity Trades
Elliott Wave Analysis

Gain a competive edge with expert insights in to:

  • Global Indices
  • US Stocks & ASX Stocks
  • Forex & Crypto
  • Commodities
Top-Notch Trading Tools

Equip yourself with the tools of success:

  • Social Chat
  • Elliott Wave Algorithm
  • Screener
  • TradingLevels
  • Trading Game
7 Elliott Wave Analysts

Stay ahead of the market with daily charts and insightful videos
-Your secret to strategic trading!

JOIN HERE


Welcome to TradingLounge (ASIC A.R.No. 321187), specialists in trades, trading education and technical analysis, covering stocks, indices, commodities, forex and cryptocurrencies.

When you join TradingLounge you have access to everything we offer, including trade tools, educational content and a social platform to chat with like-minded investors.

Read more

@Copyright 2024 by tradinglounge.com

Contact Us

Australian no: 02 4787 6020

International no: +61 (2) 47876020

Pay with:

Find us on