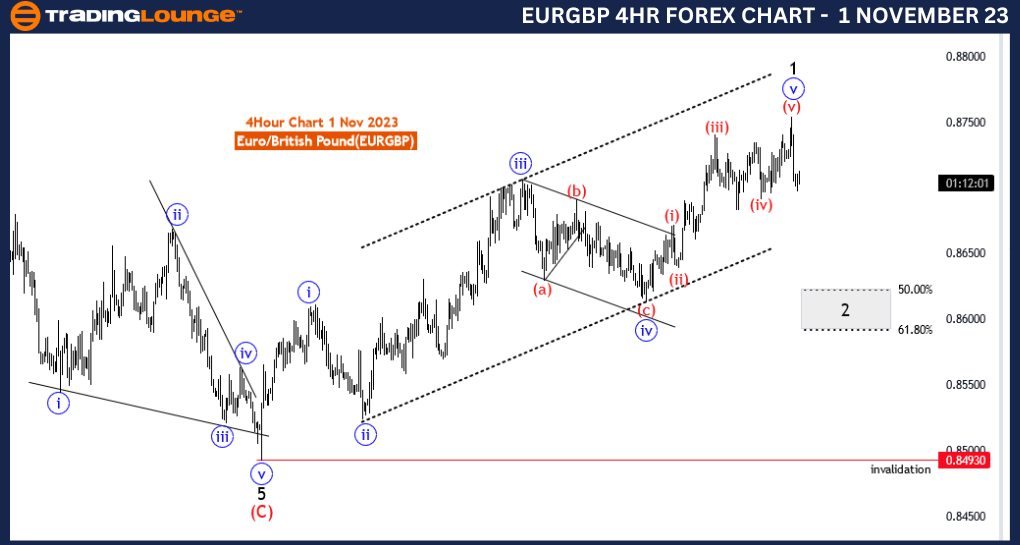
EURGBP Elliott Wave Analysis Trading Lounge 4 Hour Chart, 1 November 23
Euro/British Pound(EURGBP) 4 Hour Chart
EURGBP Elliott Wave Technical Analysis
Function: Counter Trend
Mode: corrective
Structure: black wave 2
Position: new uptrend
Direction Next Higher Degrees:black wave 3
Details:after blue wave 5 of 1 corrective wave 2 is in play . Wave Cancel invalid level: 0.84930
The "EURGBP Elliott Wave Analysis Trading Lounge 4 Hour Chart" dated 1 November 23, provides insights into the Euro/British Pound (EUR/GBP) currency pair, specifically on a 4-hour timeframe. This analysis is valuable for traders looking to understand the market's current dynamics and make informed trading decisions.
The market function is identified as "Counter Trend," which implies that the price action is currently moving against the prevailing trend. This information is crucial for traders as it suggests a potential reversal or correction in the market.
The mode is categorized as "corrective," indicating that the current price action is part of a corrective wave within the larger wave structure. Corrective waves are typically characterized by sideways or counter-trend movements and are often seen as pauses or retracements within a broader trend.
The analysis focuses on the structure of "black wave 2." Within Elliott Wave theory, "black wave 2" represents a specific phase within the wave count. This information helps traders understand where the market is within its broader wave pattern.
The position is described as a "new uptrend," suggesting that the market may be transitioning from a corrective phase (wave 2) to a new upward trend (wave 3). Traders often seek to identify the start of new trends as they can present significant trading opportunities.
The "Details" section of the analysis notes that "after blue wave 5 of 1," the corrective "wave 2" is currently in play. This implies that after completing the fifth wave of the previous pattern, a corrective phase (wave 2) has begun. Corrective waves are typically characterized by price retracements or consolidation.
The "Wave Cancel invalid level" is indicated as 0.84930. This level is important for risk management and trade validation. If the market approaches or surpasses this level, it may suggest a potential invalidation of the current wave structure, prompting traders to reconsider their trading strategies.
In summary, the EUR/GBP Elliott Wave Analysis on the 4-hour chart dated 1 November 23, provides valuable information for traders. The identification of a corrective phase (wave 2) within the larger wave structure suggests a potential shift in the market trend. Traders should closely monitor price movements near the invalidation level to assess the validity of the wave count and adapt their trading strategies accordingly. This analysis is particularly relevant for traders looking to capitalize on potential trend reversals or the resumption of a new trend in the EUR/GBP currency pair.
Technical Analyst: Malik Awais
Source: Tradinglounge.com get trial here!

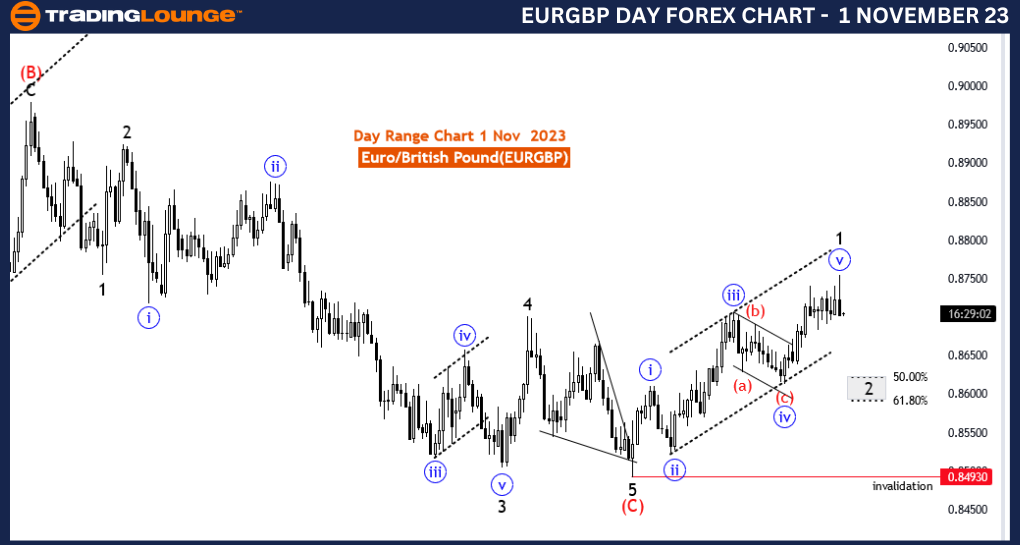
EURGBP Elliott Wave Analysis Trading Lounge Day Chart, 1 November 23
Euro/British Pound(EURGBP) Day Chart
EURGBP Elliott Wave Technical Analysis
Function: Counter Trend
Mode: corrective
Structure: black wave 2
Position: new uptrend
Direction Next Higher Degrees:black wave 3
Details:after blue wave 5 of 1 corrective wave 2 is in play . Wave Cancel invalid level: 0.84930
The "EURGBP Elliott Wave Analysis Trading Lounge Day Chart" dated 1 November 23, offers an in-depth perspective on the Euro/British Pound (EUR/GBP) currency pair, focusing on the daily chart. This analysis is essential for traders and investors aiming to comprehend the current market situation and make well-informed decisions.
The analysis identifies the market function as "Counter Trend." This suggests that the current price action is moving in the opposite direction of the primary trend. This information is crucial as it indicates the possibility of a market reversal or a corrective phase.
The "Mode" is classified as "corrective," indicating that the present price movement is part of a corrective wave. Corrective waves are often characterized by sideways or countering price movements, typically serving as temporary pauses or retracements within a broader trend.
The primary emphasis is on "black wave 2." Within Elliott Wave theory, "black wave 2" is a specific phase within the wave sequence, giving traders insights into the current position of the market within its broader wave pattern.
The analysis mentions the "Position" as a "new uptrend," which implies that the market might be transitioning from a corrective phase (wave 2) into a new upward trend (wave 3). Recognizing the initiation of new trends is of great significance to traders, as it offers substantial trading prospects.
In the "Details" section, it is noted that "after blue wave 5 of 1," the corrective "wave 2" is currently in progress. This suggests that after completing the fifth wave of the prior pattern, a corrective phase (wave 2) has begun. Corrective waves are typically characterized by price retracements or consolidation.
The "Wave Cancel invalid level" is specified as 0.84930. This level serves as a critical reference for risk management and trade validation. Should the market approach or exceed this level, it may suggest a potential invalidation of the existing wave structure, prompting traders to reconsider their trading strategies.
To sum up, the EUR/GBP Elliott Wave Analysis on the daily chart dated 1 November 23, provides vital insights for traders and investors. The identification of a corrective phase (wave 2) within the broader wave structure suggests the potential for a shift in the market trend. Traders should diligently monitor price movements near the invalidation level to assess the validity of the wave count and adapt their trading approaches accordingly. This analysis is particularly pertinent for those interested in capitalizing on potential trend reversals or the commencement of a new trend in the EUR/GBP currency pair.
Technical Analyst: Malik Awais
Source: Tradinglounge.com get trial here!
