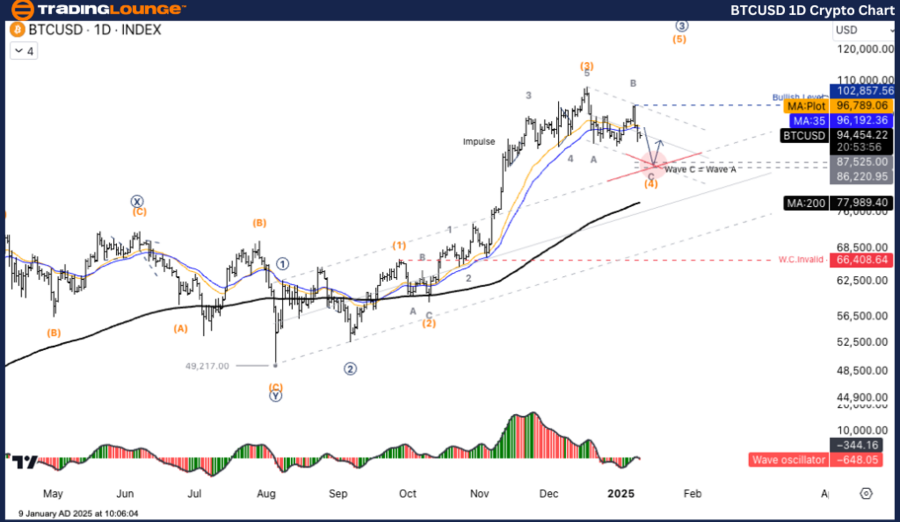
Bitcoin/ U.S. Dollar (BTCUSD) Daily Chart Analysis
BTCUSD Elliott Wave Technical Analysis
Function: Counter-Trend
Mode: Corrective
Structure: Zigzag
Position: Wave C
Next Higher Degree: Wave (4)
Wave Cancelation Level: Pending
Details:
Wave C's downward trend is projected to test the $87,525 support level.
BTCUSD Trading Strategy:
Bitcoin's corrective movement might stabilize around $87,525–$86,220, where Wave A equals Wave C and aligns with a channel support test. It is advisable to wait for Wave C completion before re-entering the uptrend.
BTCUSD Technical Indicators:
- The price remains above the MA200, suggesting a sustained uptrend.
- The Wave Oscillator reflects bullish momentum, reinforcing potential upward movement.

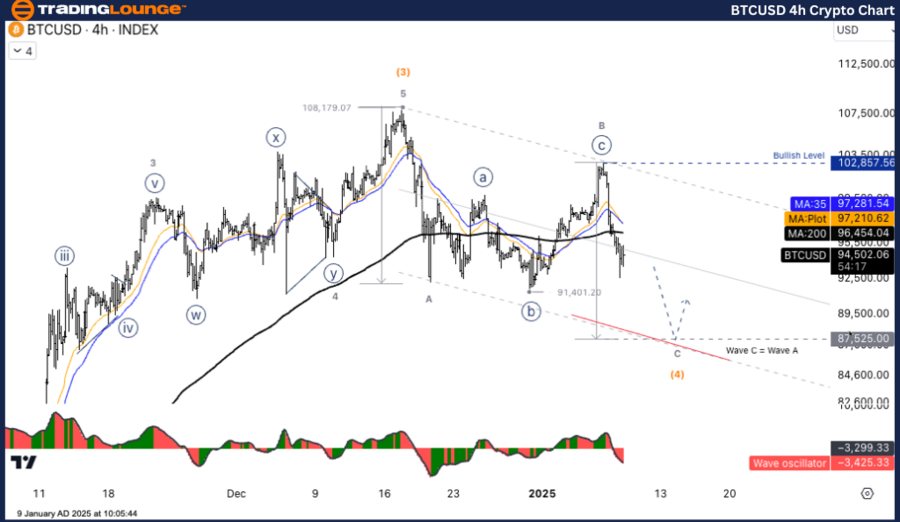
Bitcoin/ U.S. Dollar (BTCUSD) 4-Hour Chart Analysis
BTCUSD Elliott Wave Technical Analysis
Function: Counter-Trend
Mode: Corrective
Structure: Zigzag
Position: Wave C
Next Higher Degree: Wave (4)
Wave Cancelation Level: Pending
Details:
Wave C's downward movement continues to aim for a test at the $87,525 level.
BTCUSD Trading Strategy:
Bitcoin's corrective phase may find support between $87,525–$86,220, coinciding with Wave A's and Wave C's equality and a potential channel test. Waiting for Wave C completion is recommended before entering the market for the next upward cycle.
BTCUSD Technical Indicators:
- The price is below the MA200, signaling a short-term downtrend.
- The Wave Oscillator indicates bearish momentum, highlighting the current market correction.
Technical Analyst: Kittiampon Somboonsod
Source: visit Tradinglounge.com and learn From the Experts Join TradingLounge Here
Previous: NEOUSD Elliott Wave Technical Analysis
VALUE Offer - Buy 1 Month & Get 3 Months!Click here
Access 7 Analysts Over 200 Markets Covered. Chat Room With Support
